Every neighbourhood in Winnipeg, by average household income
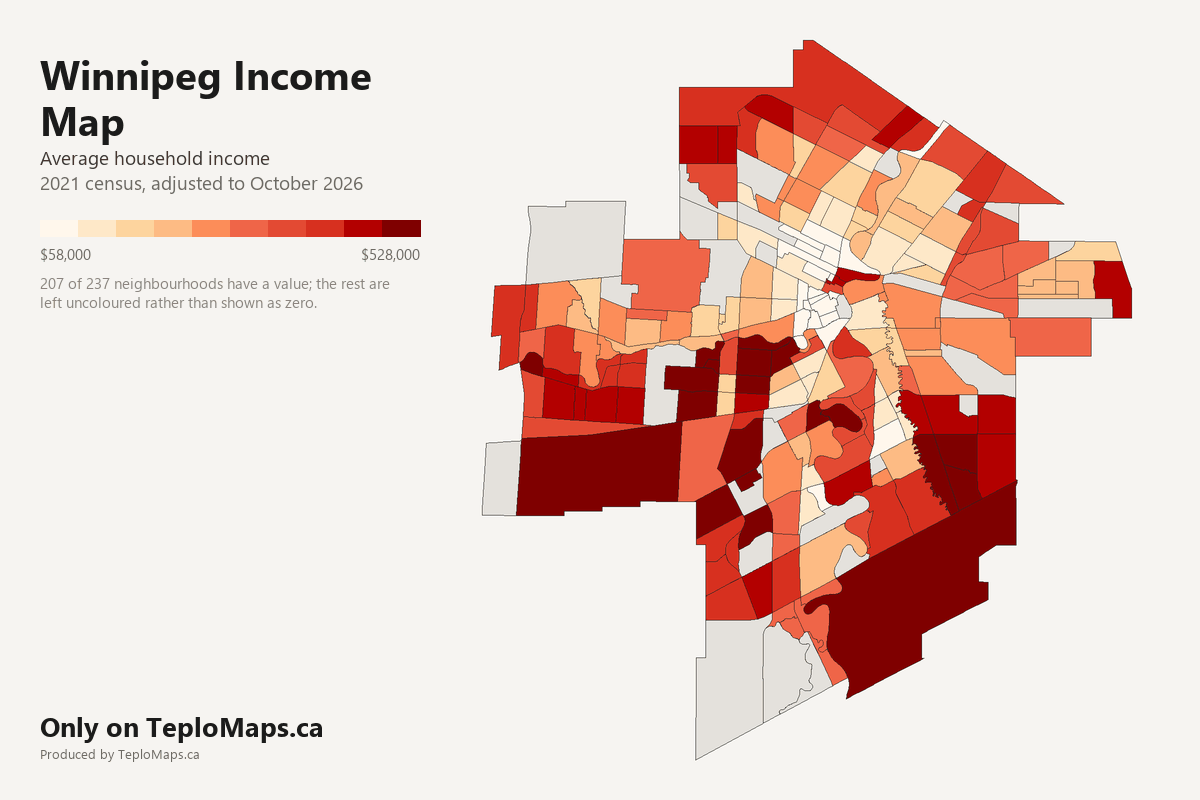
Show the figures for all 237 neighbourhoods
| Neighbourhood | Average household income | Average income after tax |
|---|---|---|
| Agassiz | $75,500 | $67,500 |
| Airport | $122,500 | $100,000 |
| Alpine Place | $89,500 | $76,000 |
| Amber Trails | $160,500 | $136,000 |
| Archwood | $99,000 | $83,000 |
| Armstrong Point | $62,500 | $54,500 |
| Assiniboia Downs | $142,500 | $114,500 |
| Assiniboine Park | no data | no data |
| Beaumont | $128,500 | $107,000 |
| Betsworth | $157,500 | $126,000 |
| Birchwood | $108,500 | $90,500 |
| Booth | $119,000 | $98,000 |
| Bridgwater Centre | $147,500 | $118,500 |
| Bridgwater Forest | $252,000 | $192,500 |
| Bridgwater Lakes | $147,500 | $118,500 |
| Bridgwater Trails | $147,500 | $118,500 |
| Broadway-Assiniboine | $70,500 | $60,000 |
| Brockville | $144,000 | $113,000 |
| Brooklands | $103,500 | $91,500 |
| Bruce Park | $109,500 | $90,500 |
| Buchanan | $142,500 | $114,500 |
| Buffalo | no data | no data |
| Burrows Central | $99,000 | $86,000 |
| Burrows-Keewatin | $85,500 | $76,000 |
| Canterbury Park | $149,500 | $122,500 |
| Centennial | $73,000 | $65,000 |
| Central Park | $58,000 | $52,000 |
| Central River Heights | $177,000 | $136,500 |
| Central St. Boniface | $88,500 | $74,500 |
| Chalmers | $86,000 | $74,500 |
| Chevrier | $120,000 | $101,500 |
| China Town | $72,500 | $63,500 |
| Civic Centre | $156,000 | $110,500 |
| Cloutier Drive | $130,000 | $106,500 |
| Colony | $62,500 | $54,500 |
| Crescent Park | $114,000 | $93,000 |
| Crescentwood | $184,000 | $137,500 |
| Crestview | $113,500 | $95,000 |
| Dakota Crossing | $147,000 | $118,000 |
| Daniel McIntyre | $90,000 | $78,500 |
| Deer Lodge | $119,500 | $98,000 |
| Dufferin | $75,500 | $68,500 |
| Dufferin Industrial | $70,500 | $64,500 |
| Dufresne | $99,000 | $83,000 |
| Dugald | no data | no data |
| Eaglemere | $139,500 | $116,000 |
| Earl Grey | $95,500 | $81,000 |
| East Elmwood | $96,500 | $84,000 |
| Ebby-Wentworth | $95,500 | $81,000 |
| Edgeland | $204,000 | $148,000 |
| Elm Park | $137,000 | $110,000 |
| Elmhurst | $162,000 | $128,500 |
| Eric Coy | $151,000 | $119,500 |
| Exchange District | $131,500 | $96,500 |
| Fairfield Park | $122,500 | $100,000 |
| Fort Richmond | $105,000 | $88,500 |
| Fraipont | $204,500 | $157,000 |
| Garden City | $119,000 | $100,000 |
| Glendale | $124,000 | $104,000 |
| Glenelm | $111,000 | $94,500 |
| Glenwood | $107,500 | $89,500 |
| Grant Park | $85,500 | $74,500 |
| Grassie | $137,000 | $113,500 |
| Griffin | no data | no data |
| Heritage Park | $100,500 | $84,500 |
| Holden | $119,500 | $99,500 |
| Inkster Gardens | $149,000 | $126,000 |
| Inkster Industrial Park | no data | no data |
| Inkster-Faraday | $94,000 | $83,000 |
| Island Lakes | $183,000 | $144,000 |
| J. B. Mitchell | $102,500 | $84,500 |
| Jameswood | $120,500 | $100,500 |
| Jefferson | $100,000 | $85,500 |
| Kensington | $101,000 | $86,500 |
| Kern Park | $110,000 | $93,500 |
| Kil-Cona Park | $139,500 | $116,000 |
| Kildare-Redonda | $105,000 | $89,500 |
| Kildonan Crossing | $139,500 | $116,000 |
| Kildonan Drive | $106,500 | $87,500 |
| Kildonan Park | no data | no data |
| King Edward | $104,000 | $89,000 |
| Kingston Crescent | $138,000 | $110,500 |
| Kirkfield | $118,000 | $96,000 |
| La Barriere | no data | no data |
| Lavalee | $81,500 | $70,500 |
| Legislature | $62,500 | $54,500 |
| Leila North | $130,500 | $111,500 |
| Leila-McPhillips Triangle | $104,000 | $89,500 |
| Linden Ridge | $252,000 | $192,500 |
| Linden Woods | $194,500 | $147,000 |
| Logan-C.P.R. | $74,000 | $65,000 |
| Lord Roberts | $103,500 | $86,500 |
| Lord Selkirk Park | $58,000 | $54,500 |
| Luxton | $100,500 | $86,000 |
| Maginot | $109,500 | $92,500 |
| Mandalay West | $142,000 | $120,500 |
| Maple Grove Park | no data | no data |
| Margaret Park | $90,000 | $78,000 |
| Marlton | $140,000 | $110,500 |
| Mathers | $102,500 | $84,500 |
| Maybank | $105,000 | $89,000 |
| McLeod Industrial | no data | no data |
| McMillan | $132,500 | $103,000 |
| Meadowood | $110,500 | $93,000 |
| Meadows | $124,000 | $103,500 |
| Melrose | $111,000 | $94,000 |
| Minnetonka | $169,000 | $132,000 |
| Minto | $105,000 | $89,500 |
| Mission Gardens | $128,500 | $108,000 |
| Mission Industrial | $115,500 | $96,500 |
| Montcalm | $80,500 | $71,000 |
| Munroe East | $95,500 | $82,500 |
| Munroe West | $101,000 | $86,000 |
| Murray Industrial Park | no data | no data |
| Mynarski | $116,000 | $100,500 |
| Niakwa Park | $124,000 | $104,000 |
| Niakwa Place | $150,000 | $121,000 |
| Norberry | $137,500 | $110,500 |
| Normand Park | $136,500 | $104,500 |
| North Inkster Industrial | $149,000 | $126,000 |
| North Point Douglas | $67,500 | $60,500 |
| North River Heights | $220,000 | $162,000 |
| North St. Boniface | $120,000 | $96,000 |
| North Transcona Yards | no data | no data |
| Norwood East | $96,500 | $81,000 |
| Norwood West | $141,500 | $111,500 |
| Oak Point Highway | no data | no data |
| Old Tuxedo | $226,500 | $161,500 |
| Omand's Creek Industrial | no data | no data |
| Pacific Industrial | no data | no data |
| Parc La Salle | $130,000 | $106,500 |
| Parker | no data | no data |
| Peguis | $128,000 | $106,500 |
| Pembina Strip | $92,500 | $78,500 |
| Perrault | no data | no data |
| Point Road | $176,000 | $136,000 |
| Polo Park | $101,000 | $86,500 |
| Portage & Main | $78,000 | $65,000 |
| Portage-Ellice | $58,000 | $52,000 |
| Prairie Pointe | $147,500 | $118,500 |
| Pulberry | $137,500 | $110,500 |
| Radisson | $112,000 | $94,500 |
| Regent | $128,000 | $107,500 |
| Richmond Lakes | $130,000 | $106,500 |
| Richmond West | $140,000 | $114,500 |
| Ridgedale | $143,000 | $113,000 |
| Ridgewood South | $134,000 | $110,000 |
| River East | $136,500 | $110,000 |
| River Park South | $144,000 | $116,000 |
| River West Park | $179,000 | $139,500 |
| River-Osborne | $73,000 | $62,500 |
| Riverbend | $152,500 | $125,500 |
| Rivergrove | $144,000 | $118,000 |
| Riverview | $121,500 | $97,500 |
| Robertson | $119,500 | $102,500 |
| Roblin Park | $166,500 | $132,500 |
| Rockwood | $106,500 | $88,500 |
| Roslyn | $114,000 | $90,500 |
| Rosser-Old Kildonan | $141,500 | $120,000 |
| Rossmere-A | $104,000 | $88,000 |
| Rossmere-B | $105,000 | $88,500 |
| Royalwood | $191,000 | $149,000 |
| Sage Creek | $172,000 | $136,000 |
| Sargent Park | $109,500 | $93,500 |
| Saskatchewan North | no data | no data |
| Seven Oaks | $115,500 | $96,500 |
| Shaughnessy Park | $113,500 | $98,500 |
| Silver Heights | $110,000 | $92,500 |
| Sir John Franklin | $139,000 | $109,500 |
| South Point Douglas | $156,000 | $110,500 |
| South Pointe | $156,500 | $126,500 |
| South Portage | $76,000 | $64,000 |
| South River Heights | $172,500 | $134,000 |
| South Tuxedo | $297,500 | $203,500 |
| Southboine | $156,000 | $123,000 |
| Southdale | $153,500 | $124,000 |
| Southland Park | $156,000 | $126,000 |
| Spence | $61,500 | $56,000 |
| Springfield North | $148,500 | $122,000 |
| Springfield South | $148,500 | $122,000 |
| St. Boniface Industrial Park | $119,500 | $99,500 |
| St. George | $89,500 | $76,000 |
| St. James Industrial | no data | no data |
| St. John's | $88,500 | $78,500 |
| St. John's Park | $100,500 | $86,000 |
| St. Matthews | $87,500 | $77,000 |
| St. Norbert | $130,000 | $106,500 |
| St. Vital Centre | no data | no data |
| St. Vital Perimeter South | $221,500 | $162,000 |
| Stock Yards | $112,500 | $94,000 |
| Sturgeon Creek | $109,000 | $91,000 |
| Symington Yards | no data | no data |
| Talbot-Grey | $80,500 | $70,500 |
| Templeton-Sinclair | $124,000 | $104,000 |
| The Forks | no data | no data |
| The Maples | $114,500 | $100,000 |
| The Mint | no data | no data |
| Tissot | $120,000 | $96,000 |
| Transcona North | $101,500 | $86,500 |
| Transcona South | $127,000 | $107,000 |
| Transcona Yards | no data | no data |
| Trappistes | no data | no data |
| Turnbull Drive | $130,000 | $106,500 |
| Tuxedo | $260,000 | $181,000 |
| Tuxedo Industrial | $125,500 | $100,000 |
| Tyndall Park | $133,000 | $114,000 |
| Tyne-Tees | no data | no data |
| University | no data | no data |
| Valhalla | $78,000 | $67,000 |
| Valley Gardens | $108,000 | $93,000 |
| Varennes | $88,500 | $76,000 |
| Varsity View | $140,000 | $110,500 |
| Vialoux | $140,000 | $110,500 |
| Victoria Crescent | $137,500 | $110,500 |
| Victoria West | $111,000 | $93,500 |
| Vista | $113,500 | $95,500 |
| Waverley Heights | $122,000 | $102,500 |
| Waverley West B | no data | no data |
| Wellington Crescent | $280,500 | $197,000 |
| West Alexander | $78,500 | $69,500 |
| West Broadway | $64,500 | $56,000 |
| West Fort Garry Industrial | no data | no data |
| West Kildonan Industrial | $134,000 | $112,500 |
| West Perimeter South | no data | no data |
| West Wolseley | $130,000 | $102,000 |
| Westdale | $132,000 | $109,000 |
| Weston | $91,000 | $80,000 |
| Weston Shops | no data | no data |
| Westwood | $145,000 | $118,000 |
| Whyte Ridge | $191,500 | $152,000 |
| Wildwood | $176,000 | $136,000 |
| Wilkes South | $528,000 | $389,500 |
| William Whyte | $73,500 | $66,500 |
| Windsor Park | $116,000 | $97,500 |
| Wolseley | $114,500 | $93,500 |
| Woodhaven | $119,000 | $98,000 |
| Worthington | $77,500 | $67,000 |
What the map shows
Average total household income in the City of Winnipeg's neighbourhoods, as of October 2026. All numbers are rounded to the nearest 500 dollars. Total income means income from all sources, such as employment, investment, pensions and government programs.
Here are some interesting facts:
Top 3 neighbourhoods by average household income:
Bottom 3 neighbourhoods by average household income:
Sources and licence
Back to the map