Every neighbourhood in Metro Toronto, by European
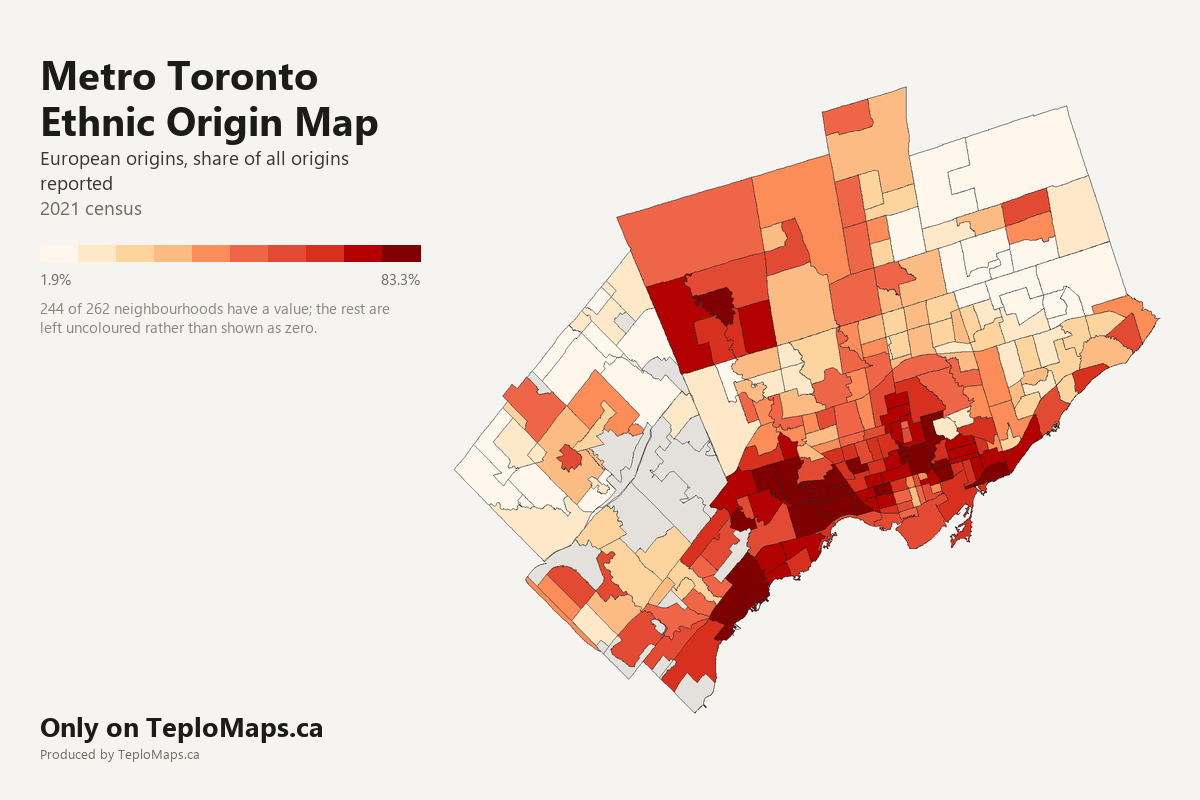
Show the figures for all 262 neighbourhoods
| Neighbourhood | City | European | East and Southeast Asian | South Asian | African and Caribbean | Canadian and North American | Middle Eastern and North African | Latin American | Indigenous | European, origins reported | East and Southeast Asian, origins reported | South Asian, origins reported | African and Caribbean, origins reported | Canadian and North American, origins reported | Middle Eastern and North African, origins reported | Latin American, origins reported | Indigenous, origins reported | Other, origins reported | Residents, estimated |
|---|---|---|---|---|---|---|---|---|---|---|---|---|---|---|---|---|---|---|---|
| Agincourt North | Toronto | 10.3% | 55.0% | 17.8% | 6.4% | 3.1% | 1.8% | 0.2% | 0.0% | 3,050 | 16,360 | 5,290 | 1,920 | 910 | 550 | 60 | 10 | 1,590 | 26,950 |
| Agincourt South-Malvern West | Toronto | 15.3% | 45.6% | 19.3% | 8.4% | 3.1% | 2.3% | 1.1% | 0.1% | 4,190 | 12,490 | 5,300 | 2,310 | 840 | 630 | 310 | 40 | 1,320 | 24,270 |
| Airport | Mississauga | no data | no data | no data | no data | no data | no data | no data | no data | - | - | - | - | - | - | - | - | - | - |
| Airport Intermodal Area | Brampton | 3.6% | 2.5% | 60.5% | 8.4% | 2.8% | 2.4% | 0.1% | 0.0% | 0 | 0 | 70 | 10 | 0 | 0 | 0 | 0 | 20 | 100 |
| Alderwood | Toronto | 71.5% | 8.3% | 3.6% | 2.9% | 8.8% | 1.1% | 1.6% | 1.0% | 13,420 | 1,550 | 670 | 540 | 1,650 | 200 | 290 | 180 | 260 | 12,550 |
| Annex | Toronto | 68.4% | 8.2% | 3.2% | 3.0% | 6.3% | 3.7% | 1.5% | 0.5% | 34,170 | 4,100 | 1,580 | 1,510 | 3,140 | 1,860 | 750 | 270 | 2,570 | 29,220 |
| Applewood | Mississauga | 55.5% | 13.2% | 10.5% | 5.8% | 6.3% | 3.9% | 1.6% | 0.4% | 25,650 | 6,090 | 4,830 | 2,660 | 2,920 | 1,800 | 760 | 180 | 1,340 | 36,480 |
| Around Maple | Vaughan | 40.0% | 19.5% | 6.1% | 2.9% | 4.7% | 12.0% | 1.2% | 0.0% | 32,930 | 16,070 | 5,020 | 2,380 | 3,850 | 9,890 | 1,020 | 20 | 11,100 | 62,360 |
| Avondale | Toronto | 30.0% | 31.1% | 8.8% | 2.7% | 3.3% | 16.3% | 2.6% | 0.1% | 5,220 | 5,400 | 1,520 | 470 | 580 | 2,830 | 450 | 10 | 900 | 13,780 |
| Banbury-Don Mills | Toronto | 47.5% | 20.3% | 8.2% | 5.0% | 5.4% | 7.6% | 1.1% | 0.2% | 17,700 | 7,560 | 3,070 | 1,880 | 2,020 | 2,840 | 430 | 90 | 1,700 | 27,180 |
| Bathurst Manor | Toronto | 45.3% | 18.6% | 2.6% | 3.3% | 5.4% | 8.8% | 2.4% | 0.6% | 9,410 | 3,860 | 550 | 680 | 1,120 | 1,840 | 510 | 120 | 2,700 | 15,880 |
| Bay-Cloverhill | Toronto | 40.6% | 30.1% | 7.7% | 3.2% | 3.9% | 7.9% | 1.9% | 0.2% | 9,200 | 6,820 | 1,740 | 720 | 880 | 1,790 | 440 | 40 | 1,050 | 16,620 |
| Bayview Village | Toronto | 28.6% | 35.2% | 6.0% | 3.6% | 3.4% | 15.4% | 2.6% | 0.0% | 7,700 | 9,480 | 1,630 | 960 | 920 | 4,140 | 700 | 10 | 1,380 | 22,310 |
| Bayview Woods-Steeles | Toronto | 31.3% | 36.4% | 4.4% | 5.0% | 4.2% | 11.5% | 1.0% | 0.0% | 4,490 | 5,220 | 630 | 720 | 600 | 1,650 | 150 | 0 | 860 | 12,090 |
| Bedford Park-Nortown | Toronto | 56.9% | 9.7% | 1.7% | 2.1% | 8.1% | 5.0% | 1.5% | 0.2% | 19,550 | 3,340 | 570 | 720 | 2,800 | 1,710 | 520 | 80 | 5,080 | 22,260 |
| Beechborough-Greenbrook | Toronto | 38.5% | 11.4% | 5.1% | 29.8% | 5.2% | 1.4% | 5.9% | 0.8% | 2,830 | 840 | 370 | 2,190 | 380 | 110 | 430 | 60 | 140 | 6,330 |
| Bendale South | Toronto | 28.6% | 17.3% | 30.5% | 10.9% | 5.1% | 2.9% | 0.3% | 0.2% | 3,660 | 2,220 | 3,900 | 1,390 | 650 | 380 | 40 | 30 | 530 | 10,730 |
| Bendale-Glen Andrew | Toronto | 25.1% | 24.8% | 27.0% | 6.5% | 5.2% | 5.3% | 1.1% | 0.3% | 5,780 | 5,700 | 6,210 | 1,490 | 1,190 | 1,220 | 260 | 80 | 1,070 | 18,580 |
| Birchcliffe-Cliffside | Toronto | 69.8% | 6.0% | 6.7% | 4.3% | 8.5% | 1.2% | 0.8% | 0.9% | 26,870 | 2,330 | 2,560 | 1,660 | 3,260 | 460 | 310 | 350 | 690 | 22,920 |
| Black Creek | Toronto | 15.5% | 20.4% | 7.5% | 31.5% | 4.9% | 7.8% | 6.8% | 0.1% | 3,650 | 4,800 | 1,770 | 7,390 | 1,160 | 1,820 | 1,590 | 20 | 1,300 | 21,120 |
| Blake-Jones | Toronto | 62.3% | 10.5% | 4.4% | 7.3% | 6.9% | 1.8% | 1.3% | 2.1% | 7,970 | 1,340 | 560 | 930 | 880 | 230 | 170 | 260 | 430 | 7,430 |
| Bram East | Brampton | 5.0% | 3.1% | 54.0% | 12.5% | 3.9% | 4.8% | 0.7% | 0.0% | 3,170 | 2,000 | 34,550 | 8,010 | 2,500 | 3,070 | 440 | 0 | 10,240 | 54,880 |
| Bram West | Brampton | 15.2% | 7.2% | 47.9% | 9.0% | 2.9% | 4.6% | 0.6% | 0.2% | 4,240 | 2,010 | 13,350 | 2,500 | 820 | 1,290 | 170 | 60 | 3,440 | 23,080 |
| Bramalea | Brampton | 39.7% | 6.8% | 21.3% | 13.4% | 8.4% | 1.3% | 3.1% | 1.0% | 35,620 | 6,080 | 19,110 | 12,050 | 7,550 | 1,170 | 2,740 | 890 | 4,440 | 67,320 |
| Brampton Flowertown | Brampton | 35.7% | 6.0% | 25.6% | 14.9% | 7.5% | 1.1% | 2.0% | 0.6% | 48,760 | 8,260 | 35,030 | 20,320 | 10,290 | 1,460 | 2,740 | 860 | 8,870 | 105,300 |
| Brampton Mobility Hub | Brampton | 37.8% | 7.0% | 19.7% | 14.1% | 7.7% | 2.1% | 2.9% | 1.8% | 890 | 170 | 460 | 330 | 180 | 50 | 70 | 40 | 160 | 1,660 |
| Brampton South | Brampton | no data | no data | no data | no data | no data | no data | no data | no data | - | - | - | - | - | - | - | - | - | - |
| Briar Hill-Belgravia | Toronto | 49.9% | 19.9% | 2.6% | 7.6% | 5.0% | 2.3% | 6.6% | 0.7% | 9,170 | 3,660 | 470 | 1,390 | 930 | 410 | 1,210 | 130 | 1,020 | 14,530 |
| Bridle Path-Sunnybrook-York Mills | Toronto | 64.4% | 13.6% | 2.2% | 0.6% | 6.0% | 7.6% | 0.6% | 0.0% | 8,980 | 1,900 | 310 | 90 | 840 | 1,060 | 80 | 0 | 680 | 8,970 |
| Broadview North | Toronto | 65.1% | 8.3% | 4.4% | 5.2% | 6.1% | 4.1% | 2.7% | 1.0% | 11,180 | 1,430 | 750 | 890 | 1,040 | 710 | 460 | 160 | 540 | 11,110 |
| Brookhaven-Amesbury | Toronto | 31.2% | 17.3% | 6.5% | 27.2% | 4.8% | 1.4% | 8.9% | 0.8% | 6,400 | 3,560 | 1,330 | 5,590 | 990 | 290 | 1,830 | 170 | 390 | 17,390 |
| Buttonville | Markham | 15.0% | 64.5% | 7.3% | 1.9% | 3.2% | 2.9% | 0.4% | 0.0% | 3,080 | 13,240 | 1,500 | 400 | 660 | 580 | 80 | 0 | 980 | 18,090 |
| Cabbagetown-South St.James Town | Toronto | 69.3% | 8.7% | 3.8% | 3.9% | 6.4% | 1.6% | 2.5% | 1.2% | 12,890 | 1,610 | 700 | 720 | 1,190 | 290 | 460 | 220 | 500 | 11,060 |
| Caledonia-Fairbank | Toronto | 59.1% | 11.7% | 2.1% | 7.7% | 4.6% | 2.3% | 8.8% | 0.8% | 7,420 | 1,470 | 270 | 970 | 580 | 290 | 1,110 | 90 | 370 | 10,040 |
| Casa Loma | Toronto | 68.1% | 5.8% | 2.6% | 2.8% | 6.3% | 2.5% | 2.0% | 0.5% | 13,140 | 1,120 | 510 | 540 | 1,220 | 490 | 380 | 100 | 1,790 | 11,240 |
| Centennial Scarborough | Toronto | 52.8% | 9.8% | 14.3% | 9.7% | 7.7% | 2.9% | 0.2% | 0.7% | 10,820 | 2,000 | 2,930 | 1,980 | 1,580 | 590 | 50 | 150 | 410 | 13,370 |
| Central Erin Mills | Mississauga | 29.5% | 20.8% | 21.1% | 5.1% | 3.8% | 12.1% | 1.1% | 0.4% | 13,660 | 9,640 | 9,790 | 2,370 | 1,790 | 5,630 | 510 | 180 | 2,820 | 36,320 |
| Church-Wellesley | Toronto | 51.6% | 18.7% | 8.5% | 3.4% | 4.3% | 5.6% | 3.1% | 1.2% | 16,950 | 6,150 | 2,800 | 1,100 | 1,410 | 1,830 | 1,030 | 390 | 1,170 | 22,320 |
| Churchill Meadows | Mississauga | 16.3% | 16.2% | 30.2% | 5.7% | 3.2% | 20.0% | 1.2% | 0.1% | 9,540 | 9,510 | 17,710 | 3,320 | 1,850 | 11,700 | 680 | 40 | 4,190 | 48,140 |
| Churchill Meadows Employment Area | Mississauga | no data | no data | no data | no data | no data | no data | no data | no data | - | - | - | - | - | - | - | - | - | - |
| Clairlea-Birchmount | Toronto | 37.2% | 17.2% | 19.9% | 11.1% | 6.8% | 2.7% | 0.9% | 0.5% | 12,700 | 5,860 | 6,790 | 3,800 | 2,320 | 940 | 320 | 180 | 1,220 | 26,670 |
| Clairville Conservation | Brampton | no data | no data | no data | no data | no data | no data | no data | no data | - | - | - | - | - | - | - | - | - | - |
| Clanton Park | Toronto | 39.4% | 21.3% | 3.2% | 5.5% | 6.3% | 6.3% | 2.6% | 0.1% | 9,130 | 4,940 | 750 | 1,280 | 1,470 | 1,470 | 610 | 20 | 3,510 | 17,580 |
| Clarkson - Lorne Park | Mississauga | 65.9% | 8.1% | 7.3% | 3.6% | 8.2% | 3.0% | 1.3% | 0.5% | 39,670 | 4,880 | 4,420 | 2,170 | 4,960 | 1,790 | 760 | 300 | 1,250 | 38,740 |
| Clarkson Employment Area | Mississauga | no data | no data | no data | no data | no data | no data | no data | no data | - | - | - | - | - | - | - | - | - | - |
| Cliffcrest | Toronto | 54.6% | 8.8% | 15.6% | 6.6% | 7.4% | 2.2% | 0.6% | 1.2% | 12,950 | 2,090 | 3,710 | 1,560 | 1,760 | 510 | 150 | 280 | 700 | 16,320 |
| Concord-Vaughan | Vaughan | 43.2% | 15.1% | 2.5% | 2.4% | 5.2% | 10.2% | 0.8% | 0.0% | 32,420 | 11,320 | 1,880 | 1,790 | 3,910 | 7,660 | 630 | 0 | 15,500 | 55,870 |
| Cooksville | Mississauga | 47.7% | 13.7% | 12.4% | 7.3% | 5.7% | 7.1% | 1.7% | 0.4% | 16,200 | 4,650 | 4,200 | 2,480 | 1,930 | 2,420 | 570 | 120 | 1,370 | 27,000 |
| Cornell | Markham | 17.0% | 33.3% | 28.1% | 7.8% | 4.4% | 2.6% | 0.6% | 0.2% | 6,480 | 12,680 | 10,710 | 2,960 | 1,660 | 990 | 240 | 90 | 2,260 | 30,240 |
| Corso Italia-Davenport | Toronto | 72.1% | 5.6% | 1.4% | 4.8% | 5.7% | 0.9% | 5.6% | 0.7% | 14,210 | 1,100 | 280 | 940 | 1,130 | 180 | 1,110 | 140 | 630 | 13,260 |
| Countryside Villages | Brampton | 4.3% | 3.0% | 57.9% | 11.9% | 2.8% | 2.7% | 1.3% | 0.0% | 340 | 230 | 4,550 | 930 | 220 | 210 | 100 | 0 | 1,270 | 6,920 |
| Credit Valley | Brampton | 6.6% | 5.9% | 57.1% | 8.9% | 3.5% | 2.3% | 0.1% | 0.0% | 3,210 | 2,850 | 27,810 | 4,320 | 1,690 | 1,110 | 40 | 20 | 7,690 | 41,550 |
| Creditview | Mississauga | 33.4% | 26.6% | 16.1% | 6.4% | 4.6% | 6.6% | 2.0% | 0.1% | 3,820 | 3,040 | 1,840 | 730 | 520 | 760 | 230 | 10 | 480 | 9,680 |
| Danforth | Toronto | 71.3% | 8.6% | 4.7% | 2.6% | 7.2% | 1.3% | 0.7% | 0.8% | 11,400 | 1,370 | 750 | 410 | 1,160 | 210 | 110 | 120 | 450 | 9,290 |
| Danforth East York | Toronto | 69.0% | 10.2% | 3.4% | 3.7% | 7.3% | 1.6% | 1.5% | 1.0% | 19,920 | 2,950 | 970 | 1,070 | 2,100 | 450 | 430 | 290 | 680 | 17,080 |
| Dixie Employment Area | Mississauga | no data | no data | no data | no data | no data | no data | no data | no data | - | - | - | - | - | - | - | - | - | - |
| Don Valley Village | Toronto | 27.0% | 30.8% | 11.1% | 4.4% | 3.7% | 15.1% | 2.1% | 0.1% | 8,810 | 10,060 | 3,610 | 1,430 | 1,210 | 4,930 | 700 | 50 | 1,880 | 26,770 |
| Dorset Park | Toronto | 21.6% | 23.9% | 25.6% | 9.9% | 4.5% | 7.8% | 0.9% | 0.5% | 6,220 | 6,880 | 7,370 | 2,860 | 1,290 | 2,240 | 240 | 140 | 1,530 | 24,250 |
| Dovercourt Village | Toronto | 69.6% | 9.9% | 3.1% | 4.2% | 5.0% | 1.5% | 2.6% | 0.6% | 13,790 | 1,970 | 610 | 830 | 1,000 | 300 | 520 | 130 | 690 | 12,420 |
| Downsview | Toronto | 45.1% | 25.7% | 3.6% | 6.9% | 4.7% | 4.0% | 6.2% | 0.3% | 9,220 | 5,260 | 740 | 1,420 | 950 | 820 | 1,260 | 60 | 710 | 18,050 |
| Downtown | Mississauga | 26.9% | 15.4% | 24.1% | 7.1% | 3.6% | 13.8% | 2.7% | 0.2% | 21,230 | 12,130 | 19,070 | 5,600 | 2,870 | 10,870 | 2,100 | 170 | 4,960 | 66,250 |
| Downtown Brampton | Brampton | 56.0% | 4.5% | 11.4% | 13.0% | 9.1% | 1.0% | 1.2% | 1.2% | 9,190 | 740 | 1,870 | 2,140 | 1,490 | 160 | 190 | 190 | 420 | 11,130 |
| Downtown Yonge East | Toronto | 48.2% | 18.4% | 9.9% | 6.6% | 4.7% | 6.0% | 2.7% | 0.4% | 12,650 | 4,840 | 2,590 | 1,720 | 1,240 | 1,570 | 720 | 110 | 810 | 17,690 |
| Dufferin Grove | Toronto | 67.9% | 8.8% | 3.5% | 3.6% | 6.2% | 1.6% | 3.3% | 0.7% | 12,790 | 1,660 | 660 | 680 | 1,170 | 310 | 620 | 130 | 830 | 11,230 |
| East Credit | Mississauga | 23.0% | 20.5% | 29.2% | 6.5% | 3.7% | 9.8% | 1.1% | 0.1% | 17,560 | 15,660 | 22,270 | 4,950 | 2,830 | 7,480 | 840 | 40 | 4,750 | 63,340 |
| East End-Danforth | Toronto | 70.6% | 6.7% | 4.5% | 4.9% | 7.3% | 1.9% | 1.2% | 1.2% | 27,690 | 2,620 | 1,760 | 1,930 | 2,880 | 730 | 470 | 480 | 660 | 21,660 |
| East L'Amoreaux | Toronto | 15.5% | 44.9% | 18.3% | 8.0% | 3.7% | 4.1% | 0.5% | 0.1% | 3,750 | 10,860 | 4,420 | 1,940 | 900 | 980 | 120 | 30 | 1,190 | 21,430 |
| East Willowdale | Toronto | 25.1% | 47.1% | 4.3% | 2.3% | 3.4% | 11.9% | 0.8% | 0.2% | 4,600 | 8,640 | 800 | 420 | 630 | 2,190 | 150 | 50 | 860 | 15,540 |
| Edenbridge-Humber Valley | Toronto | 74.1% | 4.9% | 2.0% | 4.8% | 6.1% | 1.4% | 4.9% | 0.5% | 16,370 | 1,080 | 440 | 1,070 | 1,350 | 300 | 1,080 | 120 | 300 | 15,190 |
| Eglinton East | Toronto | 21.9% | 16.2% | 27.0% | 19.2% | 5.0% | 3.4% | 1.1% | 0.4% | 5,820 | 4,310 | 7,190 | 5,110 | 1,330 | 910 | 290 | 110 | 1,550 | 22,510 |
| Elms-Old Rexdale | Toronto | 36.6% | 11.8% | 6.5% | 27.2% | 5.7% | 2.8% | 7.4% | 1.0% | 4,170 | 1,350 | 740 | 3,100 | 640 | 320 | 850 | 110 | 110 | 9,390 |
| Englemount-Lawrence | Toronto | 40.5% | 18.0% | 1.1% | 8.3% | 7.1% | 3.7% | 2.4% | 0.1% | 11,570 | 5,130 | 300 | 2,360 | 2,020 | 1,050 | 700 | 30 | 5,380 | 21,330 |
| Erin Mills | Mississauga | 51.6% | 11.3% | 10.8% | 8.0% | 7.3% | 5.7% | 1.6% | 0.4% | 31,240 | 6,810 | 6,550 | 4,830 | 4,440 | 3,430 | 940 | 240 | 2,060 | 43,270 |
| Erindale | Mississauga | 48.0% | 16.9% | 12.9% | 5.7% | 5.9% | 5.5% | 1.7% | 0.6% | 13,780 | 4,840 | 3,710 | 1,620 | 1,710 | 1,570 | 480 | 170 | 810 | 22,060 |
| Eringate-Centennial-West Deane | Toronto | 67.7% | 7.9% | 5.9% | 4.8% | 6.0% | 2.2% | 2.6% | 0.6% | 17,430 | 2,040 | 1,530 | 1,240 | 1,550 | 560 | 670 | 150 | 580 | 18,400 |
| Etobicoke City Centre | Toronto | 53.1% | 13.1% | 10.5% | 7.5% | 4.9% | 3.3% | 4.1% | 0.5% | 17,460 | 4,300 | 3,460 | 2,470 | 1,600 | 1,080 | 1,350 | 170 | 980 | 23,480 |
| Etobicoke West Mall | Toronto | 53.8% | 10.8% | 9.6% | 9.0% | 4.9% | 4.1% | 3.8% | 0.7% | 8,470 | 1,710 | 1,520 | 1,420 | 770 | 650 | 600 | 110 | 530 | 11,880 |
| Fairview | Mississauga | 26.4% | 24.0% | 20.3% | 7.4% | 3.6% | 9.7% | 2.1% | 0.0% | 2,160 | 1,960 | 1,660 | 600 | 290 | 790 | 180 | 0 | 530 | 6,890 |
| Fenside-Parkwoods | Toronto | 35.7% | 15.2% | 11.4% | 14.0% | 5.3% | 11.7% | 2.7% | 0.7% | 9,700 | 4,130 | 3,090 | 3,790 | 1,450 | 3,160 | 740 | 180 | 890 | 20,390 |
| Flemingdon Park | Toronto | 20.5% | 16.5% | 28.1% | 11.0% | 4.1% | 12.0% | 1.1% | 0.2% | 5,170 | 4,160 | 7,100 | 2,790 | 1,020 | 3,020 | 280 | 40 | 1,650 | 22,410 |
| Fletcher's Creek South | Brampton | 13.1% | 5.0% | 53.1% | 8.7% | 3.8% | 0.5% | 0.2% | 0.1% | 3,930 | 1,500 | 15,940 | 2,610 | 1,140 | 140 | 50 | 20 | 4,660 | 25,350 |
| Fletcher's Creek Village | Brampton | 18.0% | 6.3% | 36.7% | 20.8% | 6.9% | 1.0% | 1.4% | 0.4% | 2,190 | 760 | 4,470 | 2,530 | 830 | 120 | 170 | 40 | 1,050 | 9,670 |
| Fletcher's Meadow | Brampton | 16.2% | 5.9% | 40.7% | 20.2% | 5.0% | 0.8% | 1.0% | 0.1% | 10,590 | 3,870 | 26,650 | 13,220 | 3,280 | 540 | 660 | 50 | 6,590 | 53,900 |
| Forest Hill North | Toronto | 52.7% | 11.5% | 1.5% | 4.1% | 5.5% | 4.8% | 3.5% | 0.5% | 9,370 | 2,050 | 270 | 730 | 970 | 840 | 630 | 80 | 2,820 | 12,160 |
| Forest Hill South | Toronto | 60.3% | 6.5% | 2.3% | 2.7% | 6.6% | 3.6% | 2.0% | 0.2% | 10,620 | 1,150 | 410 | 480 | 1,170 | 640 | 350 | 40 | 2,770 | 11,010 |
| Fort York-Liberty Village | Toronto | 57.2% | 11.3% | 8.3% | 6.3% | 4.8% | 5.0% | 3.3% | 0.7% | 18,550 | 3,670 | 2,690 | 2,060 | 1,570 | 1,630 | 1,060 | 240 | 1,000 | 19,730 |
| Gateway Employment Area | Mississauga | no data | no data | no data | no data | no data | no data | no data | no data | - | - | - | - | - | - | - | - | - | - |
| Glenfield-Jane Heights | Toronto | 21.6% | 26.6% | 5.1% | 24.4% | 5.6% | 2.7% | 9.5% | 0.3% | 7,140 | 8,800 | 1,700 | 8,050 | 1,840 | 890 | 3,130 | 100 | 1,400 | 29,860 |
| Golfdale-Cedarbrae-Woburn | Toronto | 22.7% | 9.5% | 35.1% | 14.1% | 5.8% | 2.6% | 0.9% | 0.7% | 7,370 | 3,090 | 11,400 | 4,590 | 1,860 | 830 | 290 | 230 | 2,770 | 27,150 |
| Gore Meadows | Brampton | no data | no data | no data | no data | no data | no data | no data | no data | - | - | - | - | - | - | - | - | - | - |
| Goreway Drive Corridor | Brampton | 22.0% | 3.8% | 41.9% | 15.9% | 3.8% | 2.6% | 0.0% | 0.0% | 590 | 100 | 1,120 | 420 | 100 | 70 | 0 | 0 | 260 | 2,290 |
| Greenwood-Coxwell | Toronto | 64.9% | 11.8% | 4.3% | 3.7% | 7.6% | 2.0% | 1.1% | 1.6% | 16,730 | 3,050 | 1,100 | 960 | 1,970 | 520 | 280 | 410 | 740 | 14,120 |
| Guildwood | Toronto | 64.7% | 8.2% | 8.9% | 6.8% | 8.1% | 0.9% | 0.5% | 0.9% | 9,910 | 1,260 | 1,360 | 1,040 | 1,240 | 130 | 80 | 140 | 160 | 9,670 |
| Harbourfront-CityPlace | Toronto | 44.4% | 17.0% | 14.0% | 6.0% | 4.1% | 6.7% | 3.4% | 0.6% | 18,160 | 6,960 | 5,730 | 2,450 | 1,660 | 2,760 | 1,370 | 240 | 1,600 | 28,020 |
| Heart Lake | Brampton | no data | no data | no data | no data | no data | no data | no data | no data | - | - | - | - | - | - | - | - | - | - |
| Henry Farm | Toronto | 20.0% | 26.3% | 21.9% | 7.6% | 2.9% | 11.9% | 2.2% | 0.2% | 4,740 | 6,240 | 5,200 | 1,800 | 690 | 2,820 | 530 | 40 | 1,690 | 19,800 |
| Heritage Heights | Brampton | 13.2% | 6.7% | 43.6% | 17.2% | 4.4% | 3.5% | 0.4% | 0.3% | 40 | 20 | 120 | 50 | 10 | 10 | 0 | 0 | 30 | 220 |
| High Park North | Toronto | 75.0% | 6.4% | 2.8% | 3.2% | 5.4% | 2.0% | 2.4% | 0.5% | 28,310 | 2,400 | 1,060 | 1,200 | 2,060 | 770 | 910 | 190 | 830 | 21,810 |
| High Park-Swansea | Toronto | 76.0% | 5.3% | 3.0% | 2.9% | 6.7% | 1.6% | 2.0% | 0.7% | 30,920 | 2,160 | 1,230 | 1,170 | 2,720 | 640 | 830 | 270 | 760 | 22,840 |
| Highland Creek | Toronto | 24.0% | 13.4% | 36.8% | 14.9% | 4.5% | 1.3% | 0.5% | 0.2% | 3,760 | 2,100 | 5,760 | 2,330 | 700 | 210 | 80 | 40 | 680 | 12,650 |
| Highway 410 and Steeles | Brampton | no data | no data | no data | no data | no data | no data | no data | no data | - | - | - | - | - | - | - | - | - | - |
| Highway 427 Industrial | Brampton | 19.8% | 0.3% | 51.3% | 4.0% | 2.2% | 2.4% | 0.0% | 0.0% | 140 | 0 | 360 | 30 | 20 | 20 | 0 | 0 | 140 | 590 |
| Hillcrest Village | Toronto | 22.7% | 45.2% | 8.7% | 4.4% | 3.7% | 7.2% | 1.1% | 0.0% | 4,360 | 8,660 | 1,680 | 840 | 700 | 1,370 | 210 | 0 | 1,350 | 16,500 |
| Humber Bay Shores | Toronto | 58.4% | 10.4% | 6.9% | 5.9% | 4.6% | 5.8% | 4.7% | 0.6% | 19,210 | 3,410 | 2,280 | 1,950 | 1,530 | 1,890 | 1,540 | 190 | 890 | 22,500 |
| Humber Heights-Westmount | Toronto | 70.1% | 5.3% | 2.3% | 9.1% | 4.9% | 1.9% | 4.9% | 0.2% | 8,920 | 670 | 290 | 1,150 | 620 | 240 | 620 | 20 | 200 | 10,040 |
| Humber Summit | Toronto | 33.4% | 9.1% | 23.8% | 12.2% | 4.5% | 4.9% | 4.4% | 0.5% | 4,470 | 1,220 | 3,170 | 1,630 | 600 | 660 | 590 | 70 | 950 | 12,250 |
| Humbermede | Toronto | 22.0% | 16.6% | 14.9% | 23.8% | 4.9% | 2.2% | 10.6% | 0.4% | 4,300 | 3,250 | 2,910 | 4,650 | 950 | 430 | 2,060 | 80 | 880 | 16,810 |
| Humewood-Cedarvale | Toronto | 58.4% | 9.6% | 2.3% | 5.3% | 5.8% | 3.5% | 2.4% | 0.6% | 13,550 | 2,230 | 540 | 1,220 | 1,350 | 800 | 550 | 150 | 2,800 | 13,850 |
| Hurontario | Mississauga | 26.7% | 20.2% | 25.0% | 7.9% | 3.8% | 8.2% | 1.7% | 0.1% | 19,400 | 14,680 | 18,120 | 5,740 | 2,730 | 5,920 | 1,240 | 80 | 4,640 | 60,500 |
| Hurontario-Main Corridor | Brampton | 17.8% | 7.4% | 45.9% | 11.6% | 4.7% | 1.1% | 0.5% | 0.0% | 1,140 | 470 | 2,930 | 740 | 300 | 70 | 30 | 0 | 700 | 5,400 |
| Huttonville | Brampton | 14.7% | 6.5% | 47.7% | 8.7% | 2.9% | 6.9% | 0.9% | 0.2% | 300 | 130 | 980 | 180 | 60 | 140 | 20 | 0 | 240 | 1,660 |
| Ionview | Toronto | 29.6% | 19.7% | 22.1% | 14.2% | 5.5% | 2.0% | 1.5% | 0.2% | 4,840 | 3,220 | 3,610 | 2,320 | 890 | 330 | 240 | 40 | 870 | 13,400 |
| Islington | Toronto | 67.9% | 8.7% | 4.7% | 4.9% | 6.4% | 3.2% | 2.1% | 0.4% | 22,030 | 2,810 | 1,540 | 1,590 | 2,060 | 1,040 | 670 | 120 | 580 | 23,520 |
| Junction Area | Toronto | 72.8% | 8.9% | 2.6% | 3.8% | 5.2% | 1.3% | 2.9% | 0.8% | 17,940 | 2,200 | 630 | 930 | 1,290 | 330 | 700 | 190 | 450 | 13,990 |
| Junction-Wallace Emerson | Toronto | 63.5% | 10.1% | 4.8% | 6.1% | 6.1% | 2.0% | 3.8% | 0.8% | 22,560 | 3,600 | 1,690 | 2,160 | 2,170 | 720 | 1,330 | 290 | 1,000 | 23,230 |
| Keelesdale-Eglinton West | Toronto | 58.8% | 10.5% | 4.0% | 10.1% | 4.5% | 0.5% | 8.8% | 0.5% | 7,910 | 1,410 | 530 | 1,350 | 610 | 70 | 1,180 | 60 | 310 | 11,540 |
| Kennedy Park | Toronto | 27.2% | 19.4% | 25.9% | 14.3% | 5.9% | 2.4% | 0.7% | 0.9% | 5,520 | 3,940 | 5,250 | 2,900 | 1,190 | 500 | 130 | 180 | 680 | 16,990 |
| Kennedy Road South | Brampton | 34.5% | 7.4% | 13.6% | 27.1% | 10.0% | 2.8% | 1.0% | 0.5% | 1,270 | 270 | 500 | 1,000 | 370 | 100 | 40 | 20 | 110 | 2,840 |
| Kensington-Chinatown | Toronto | 45.0% | 30.7% | 4.3% | 5.1% | 4.7% | 3.7% | 1.7% | 1.1% | 11,470 | 7,840 | 1,090 | 1,290 | 1,210 | 950 | 420 | 270 | 950 | 18,370 |
| Kingsview Village-The Westway | Toronto | 38.8% | 7.6% | 10.9% | 23.7% | 6.5% | 4.5% | 4.4% | 0.4% | 10,440 | 2,050 | 2,930 | 6,370 | 1,760 | 1,210 | 1,190 | 110 | 850 | 22,020 |
| Kingsway South | Toronto | 83.3% | 3.5% | 1.8% | 0.8% | 8.2% | 0.8% | 0.8% | 0.1% | 12,600 | 530 | 270 | 120 | 1,250 | 120 | 110 | 20 | 100 | 8,840 |
| Kleinburg | Vaughan | 46.2% | 11.2% | 14.7% | 5.3% | 5.4% | 10.7% | 2.3% | 0.2% | 18,270 | 4,420 | 5,840 | 2,080 | 2,140 | 4,220 | 900 | 80 | 1,640 | 31,460 |
| L'Amoreaux West | Toronto | 25.6% | 30.0% | 11.9% | 9.9% | 3.0% | 14.9% | 0.8% | 0.2% | 6,460 | 7,560 | 3,000 | 2,490 | 760 | 3,750 | 190 | 40 | 980 | 21,520 |
| Lakeview | Mississauga | 72.6% | 7.0% | 3.3% | 3.5% | 7.9% | 2.1% | 1.4% | 0.5% | 24,200 | 2,330 | 1,100 | 1,180 | 2,630 | 690 | 470 | 180 | 570 | 22,310 |
| Lambton Baby Point | Toronto | 73.2% | 5.0% | 2.2% | 7.2% | 6.8% | 1.3% | 1.5% | 0.7% | 9,680 | 660 | 290 | 950 | 890 | 170 | 200 | 100 | 290 | 8,000 |
| Lansing-Westgate | Toronto | 45.1% | 20.5% | 5.0% | 1.9% | 4.8% | 8.5% | 1.8% | 0.2% | 10,030 | 4,560 | 1,110 | 430 | 1,060 | 1,900 | 410 | 40 | 2,690 | 15,990 |
| Lawrence Park North | Toronto | 69.5% | 9.7% | 2.3% | 1.6% | 8.1% | 3.1% | 0.9% | 0.1% | 18,020 | 2,520 | 600 | 410 | 2,110 | 820 | 220 | 30 | 1,190 | 14,650 |
| Lawrence Park South | Toronto | 70.8% | 7.5% | 2.6% | 1.4% | 6.9% | 3.0% | 0.5% | 0.4% | 18,730 | 1,990 | 680 | 370 | 1,820 | 780 | 130 | 90 | 1,850 | 14,970 |
| Leaside-Bennington | Toronto | 77.5% | 7.1% | 1.8% | 1.7% | 7.0% | 2.0% | 0.7% | 0.5% | 23,140 | 2,120 | 540 | 500 | 2,090 | 600 | 210 | 130 | 530 | 16,640 |
| Lisgar | Mississauga | 39.0% | 11.2% | 21.3% | 7.0% | 6.3% | 8.3% | 2.2% | 0.3% | 15,660 | 4,510 | 8,550 | 2,810 | 2,540 | 3,330 | 870 | 100 | 1,750 | 29,820 |
| Little Portugal | Toronto | 68.7% | 9.9% | 2.6% | 4.0% | 6.0% | 2.6% | 2.3% | 0.7% | 17,680 | 2,540 | 670 | 1,030 | 1,550 | 680 | 600 | 190 | 780 | 15,590 |
| Long Branch | Toronto | 66.4% | 8.3% | 4.7% | 5.4% | 7.4% | 1.5% | 2.9% | 1.3% | 12,320 | 1,550 | 870 | 1,010 | 1,370 | 280 | 530 | 250 | 390 | 11,370 |
| Malton | Mississauga | 14.8% | 2.8% | 42.8% | 21.4% | 4.7% | 1.1% | 1.2% | 0.2% | 6,400 | 1,220 | 18,540 | 9,270 | 2,040 | 480 | 530 | 70 | 4,800 | 37,960 |
| Malvern East | Toronto | 13.5% | 17.8% | 30.1% | 23.2% | 6.3% | 2.4% | 1.0% | 0.4% | 4,310 | 5,700 | 9,630 | 7,410 | 2,010 | 750 | 310 | 130 | 1,720 | 26,130 |
| Malvern West | Toronto | 9.4% | 18.5% | 39.5% | 17.4% | 4.3% | 3.0% | 0.8% | 0.4% | 1,890 | 3,730 | 7,960 | 3,500 | 870 | 610 | 160 | 70 | 1,350 | 17,270 |
| Maple | Vaughan | 56.4% | 10.0% | 10.1% | 4.8% | 5.4% | 6.7% | 3.3% | 0.2% | 22,490 | 4,000 | 4,030 | 1,910 | 2,170 | 2,680 | 1,310 | 60 | 1,190 | 33,320 |
| Maple Leaf | Toronto | 53.0% | 15.6% | 6.2% | 7.0% | 6.2% | 0.5% | 8.1% | 0.1% | 5,970 | 1,760 | 700 | 790 | 700 | 60 | 920 | 10 | 370 | 9,850 |
| Maple Teston | Vaughan | 34.9% | 13.2% | 25.3% | 6.1% | 4.9% | 7.1% | 3.3% | 0.0% | 7,470 | 2,830 | 5,410 | 1,300 | 1,040 | 1,520 | 710 | 10 | 1,150 | 17,880 |
| Markham 16th | Markham | 13.6% | 55.5% | 14.5% | 4.7% | 2.9% | 2.4% | 0.4% | 0.0% | 10,480 | 42,840 | 11,210 | 3,640 | 2,240 | 1,850 | 340 | 10 | 4,570 | 65,900 |
| Markham Cathedral | Markham | 13.2% | 64.4% | 6.5% | 2.7% | 3.8% | 5.0% | 0.3% | 0.1% | 4,330 | 21,040 | 2,140 | 880 | 1,240 | 1,640 | 90 | 30 | 1,260 | 28,640 |
| Markham Central East | Markham | 40.4% | 24.8% | 17.7% | 4.5% | 6.1% | 2.2% | 0.4% | 0.0% | 6,840 | 4,190 | 3,000 | 770 | 1,030 | 360 | 70 | 0 | 660 | 12,590 |
| Markham East | Markham | 4.5% | 30.4% | 43.4% | 6.5% | 3.3% | 1.6% | 0.1% | 0.0% | 1,770 | 11,950 | 17,050 | 2,550 | 1,300 | 640 | 50 | 0 | 4,010 | 34,380 |
| Markham Hagerman | Markham | 11.0% | 63.8% | 10.4% | 3.1% | 2.3% | 3.4% | 0.8% | 0.0% | 2,400 | 13,930 | 2,270 | 680 | 510 | 750 | 180 | 0 | 1,110 | 19,500 |
| Markham Village | Markham | 52.6% | 26.0% | 6.5% | 4.1% | 5.1% | 2.4% | 0.9% | 0.3% | 18,260 | 9,040 | 2,260 | 1,420 | 1,760 | 820 | 310 | 100 | 780 | 24,960 |
| Markham West | Markham | 29.9% | 40.4% | 5.8% | 3.3% | 4.4% | 9.8% | 0.4% | 0.0% | 8,890 | 12,010 | 1,730 | 990 | 1,300 | 2,920 | 120 | 0 | 1,760 | 23,940 |
| Markland Wood | Toronto | 79.9% | 5.8% | 2.4% | 1.1% | 6.9% | 0.7% | 1.1% | 0.4% | 12,240 | 890 | 370 | 160 | 1,060 | 110 | 170 | 60 | 240 | 10,260 |
| Mavis-Erindale Employment Area | Mississauga | no data | no data | no data | no data | no data | no data | no data | no data | - | - | - | - | - | - | - | - | - | - |
| Meadowvale | Mississauga | 52.6% | 8.5% | 12.2% | 6.4% | 8.0% | 5.4% | 2.8% | 0.8% | 29,970 | 4,850 | 6,940 | 3,670 | 4,580 | 3,060 | 1,580 | 460 | 1,830 | 38,770 |
| Meadowvale Business Park | Mississauga | no data | no data | no data | no data | no data | no data | no data | no data | - | - | - | - | - | - | - | - | - | - |
| Meadowvale Village | Mississauga | 25.6% | 12.8% | 35.6% | 6.5% | 3.7% | 4.6% | 2.1% | 0.1% | 9,920 | 4,960 | 13,800 | 2,520 | 1,440 | 1,780 | 800 | 40 | 3,500 | 31,260 |
| Milliken | Toronto | 6.6% | 70.0% | 10.5% | 4.6% | 2.5% | 0.9% | 0.1% | 0.0% | 1,700 | 18,140 | 2,730 | 1,190 | 650 | 230 | 30 | 0 | 1,260 | 24,460 |
| Milliken East | Markham | 5.3% | 57.6% | 20.8% | 5.9% | 2.3% | 0.7% | 0.2% | 0.0% | 1,160 | 12,550 | 4,540 | 1,300 | 510 | 160 | 40 | 0 | 1,560 | 20,240 |
| Milliken West | Markham | 9.7% | 63.8% | 9.9% | 4.3% | 3.0% | 2.7% | 0.3% | 0.1% | 1,570 | 10,270 | 1,600 | 700 | 490 | 430 | 40 | 20 | 980 | 14,960 |
| Mimico-Queensway | Toronto | 67.2% | 10.6% | 4.4% | 4.4% | 6.6% | 2.6% | 2.1% | 0.6% | 17,300 | 2,720 | 1,130 | 1,140 | 1,690 | 660 | 540 | 160 | 400 | 17,130 |
| Mineola | Mississauga | 72.7% | 6.5% | 7.0% | 1.2% | 7.7% | 2.5% | 0.4% | 0.3% | 10,700 | 950 | 1,030 | 170 | 1,120 | 370 | 60 | 50 | 250 | 9,840 |
| Mississauga Valleys | Mississauga | 50.3% | 11.6% | 12.1% | 6.4% | 5.3% | 7.4% | 3.2% | 0.2% | 10,720 | 2,470 | 2,570 | 1,360 | 1,130 | 1,570 | 680 | 40 | 760 | 16,570 |
| Morningside | Toronto | 24.6% | 15.2% | 27.4% | 18.3% | 5.7% | 3.3% | 0.6% | 0.2% | 5,280 | 3,270 | 5,870 | 3,930 | 1,220 | 710 | 130 | 50 | 980 | 17,650 |
| Morningside Heights | Toronto | 5.4% | 13.6% | 52.2% | 13.9% | 4.1% | 1.2% | 0.8% | 0.1% | 1,590 | 3,990 | 15,350 | 4,070 | 1,200 | 350 | 250 | 20 | 2,590 | 25,030 |
| Moss Park | Toronto | 53.2% | 12.4% | 7.3% | 10.5% | 5.6% | 4.0% | 2.4% | 1.3% | 17,960 | 4,170 | 2,480 | 3,560 | 1,900 | 1,340 | 800 | 440 | 1,120 | 21,640 |
| Mount Dennis | Toronto | 30.5% | 14.4% | 4.3% | 29.6% | 5.9% | 2.3% | 9.8% | 0.8% | 4,870 | 2,300 | 680 | 4,730 | 940 | 360 | 1,560 | 130 | 380 | 12,930 |
| Mount Olive-Silverstone-Jamestown | Toronto | 10.3% | 6.4% | 27.9% | 27.9% | 4.0% | 13.7% | 2.7% | 0.0% | 3,670 | 2,290 | 10,010 | 9,980 | 1,440 | 4,910 | 980 | 0 | 2,540 | 31,460 |
| Mount Pleasant | Brampton | 7.9% | 4.1% | 49.4% | 17.6% | 4.6% | 2.5% | 0.8% | 0.2% | 3,630 | 1,880 | 22,650 | 8,050 | 2,100 | 1,150 | 350 | 110 | 5,940 | 37,310 |
| Mount Pleasant East | Toronto | 68.8% | 9.1% | 2.4% | 2.5% | 6.8% | 3.7% | 1.8% | 0.6% | 20,000 | 2,660 | 690 | 740 | 1,980 | 1,080 | 530 | 170 | 1,220 | 16,500 |
| New Toronto | Toronto | 63.3% | 8.2% | 4.4% | 9.2% | 8.0% | 1.4% | 2.9% | 0.9% | 11,060 | 1,430 | 770 | 1,620 | 1,400 | 240 | 510 | 170 | 300 | 11,350 |
| Newtonbrook East | Toronto | 26.1% | 39.3% | 5.2% | 2.5% | 2.7% | 17.7% | 1.9% | 0.1% | 4,640 | 6,970 | 920 | 440 | 480 | 3,130 | 330 | 10 | 810 | 15,340 |
| Newtonbrook West | Toronto | 30.1% | 37.8% | 3.3% | 2.5% | 3.9% | 12.5% | 1.4% | 0.2% | 8,130 | 10,210 | 900 | 680 | 1,060 | 3,380 | 380 | 40 | 2,220 | 23,810 |
| Ninth Line | Mississauga | 37.7% | 12.2% | 19.2% | 6.6% | 5.1% | 12.5% | 1.8% | 0.2% | 1,200 | 390 | 610 | 210 | 160 | 400 | 60 | 10 | 150 | 2,400 |
| North Riverdale | Toronto | 73.2% | 10.3% | 2.3% | 2.1% | 6.5% | 0.8% | 0.6% | 0.8% | 15,950 | 2,240 | 490 | 460 | 1,410 | 180 | 140 | 180 | 740 | 11,290 |
| North St.James Town | Toronto | 36.1% | 17.3% | 16.4% | 11.0% | 4.4% | 5.7% | 2.7% | 0.8% | 8,870 | 4,250 | 4,040 | 2,720 | 1,090 | 1,410 | 670 | 190 | 1,340 | 18,500 |
| North Toronto | Toronto | 51.0% | 13.4% | 7.1% | 5.2% | 3.9% | 8.4% | 5.8% | 0.6% | 11,880 | 3,110 | 1,650 | 1,200 | 920 | 1,960 | 1,340 | 130 | 1,100 | 15,850 |
| Northeast Employment Area | Mississauga | no data | no data | no data | no data | no data | no data | no data | no data | - | - | - | - | - | - | - | - | - | - |
| Northwest Sandalwood Parkway | Brampton | 22.5% | 5.6% | 33.3% | 19.5% | 4.9% | 0.9% | 1.4% | 0.7% | 3,200 | 790 | 4,730 | 2,780 | 700 | 130 | 200 | 100 | 1,580 | 11,080 |
| O'Connor-Parkview | Toronto | 60.2% | 8.3% | 6.8% | 9.7% | 7.2% | 2.8% | 1.4% | 1.7% | 15,670 | 2,170 | 1,780 | 2,530 | 1,880 | 720 | 360 | 440 | 500 | 18,090 |
| Oakdale-Beverley Heights | Toronto | 33.4% | 18.7% | 2.7% | 25.3% | 5.2% | 2.1% | 9.6% | 0.3% | 8,200 | 4,600 | 660 | 6,220 | 1,280 | 510 | 2,350 | 70 | 670 | 21,400 |
| Oakridge | Toronto | 28.3% | 11.2% | 28.2% | 16.8% | 6.2% | 3.1% | 1.2% | 1.4% | 4,700 | 1,860 | 4,680 | 2,790 | 1,040 | 520 | 190 | 230 | 610 | 13,700 |
| Oakwood Village | Toronto | 56.2% | 10.7% | 2.2% | 10.9% | 5.6% | 1.9% | 5.6% | 0.6% | 17,540 | 3,350 | 690 | 3,390 | 1,760 | 600 | 1,740 | 190 | 1,930 | 20,680 |
| Old East York | Toronto | 71.4% | 9.2% | 1.9% | 3.4% | 7.4% | 2.0% | 0.6% | 1.1% | 9,930 | 1,290 | 270 | 470 | 1,030 | 280 | 90 | 150 | 400 | 9,230 |
| Palmerston-Little Italy | Toronto | 73.3% | 7.8% | 1.8% | 2.3% | 6.1% | 1.5% | 1.7% | 0.8% | 16,500 | 1,760 | 400 | 520 | 1,360 | 340 | 390 | 180 | 1,060 | 13,110 |
| Parkway Belt | Brampton | no data | no data | no data | no data | no data | no data | no data | no data | - | - | - | - | - | - | - | - | - | - |
| Parkwoods-O'Connor Hills | Toronto | 51.2% | 13.4% | 6.0% | 7.8% | 7.2% | 8.8% | 2.8% | 0.5% | 9,880 | 2,590 | 1,170 | 1,500 | 1,380 | 1,700 | 550 | 100 | 440 | 14,050 |
| Pelmo Park-Humberlea | Toronto | 48.8% | 15.1% | 6.6% | 14.1% | 5.6% | 1.5% | 5.7% | 0.5% | 6,570 | 2,040 | 890 | 1,900 | 760 | 210 | 770 | 60 | 280 | 11,300 |
| Playter Estates-Danforth | Toronto | 77.6% | 5.2% | 2.6% | 2.4% | 5.8% | 1.6% | 1.5% | 1.0% | 10,650 | 710 | 360 | 320 | 790 | 220 | 210 | 140 | 320 | 7,490 |
| Pleasant View | Toronto | 32.7% | 33.1% | 8.7% | 5.4% | 3.9% | 8.8% | 1.6% | 0.4% | 5,860 | 5,940 | 1,560 | 960 | 690 | 1,570 | 280 | 60 | 1,000 | 15,030 |
| Port Credit | Mississauga | 73.0% | 4.9% | 3.3% | 2.7% | 8.1% | 2.8% | 2.2% | 1.1% | 12,490 | 850 | 570 | 460 | 1,390 | 480 | 370 | 180 | 310 | 10,650 |
| Princess-Rosethorn | Toronto | 74.9% | 7.5% | 3.3% | 2.4% | 7.3% | 1.2% | 1.1% | 0.4% | 12,430 | 1,250 | 550 | 400 | 1,220 | 200 | 190 | 70 | 290 | 11,180 |
| Queen Street Corridor | Brampton | 28.0% | 6.0% | 24.5% | 21.4% | 7.0% | 4.1% | 2.1% | 0.8% | 7,810 | 1,680 | 6,830 | 5,960 | 1,950 | 1,140 | 570 | 210 | 1,760 | 22,190 |
| Rathwood | Mississauga | 60.5% | 10.5% | 8.6% | 5.9% | 4.9% | 4.2% | 2.7% | 0.4% | 20,890 | 3,620 | 2,980 | 2,050 | 1,680 | 1,460 | 940 | 130 | 790 | 27,340 |
| Regent Park | Toronto | 35.9% | 15.2% | 18.0% | 13.6% | 5.7% | 4.8% | 2.4% | 1.1% | 6,230 | 2,640 | 3,120 | 2,360 | 990 | 830 | 410 | 190 | 570 | 12,730 |
| Rexdale-Kipling | Toronto | 44.6% | 8.1% | 9.9% | 16.6% | 6.9% | 4.4% | 5.1% | 0.8% | 6,090 | 1,110 | 1,350 | 2,270 | 940 | 590 | 690 | 110 | 500 | 10,400 |
| Richmond Hill B | Richmond Hill | 24.1% | 35.6% | 6.1% | 2.8% | 3.3% | 20.3% | 1.9% | 0.2% | 4,850 | 7,150 | 1,230 | 570 | 660 | 4,070 | 380 | 40 | 1,170 | 17,000 |
| Richmond Hill Bathurst | Richmond Hill | 49.5% | 17.2% | 6.1% | 2.9% | 5.3% | 14.2% | 0.4% | 0.5% | 13,360 | 4,640 | 1,650 | 800 | 1,440 | 3,830 | 100 | 140 | 1,060 | 19,920 |
| Richmond Hill C | Richmond Hill | 37.7% | 25.1% | 4.7% | 4.3% | 4.7% | 17.3% | 1.3% | 0.2% | 7,720 | 5,140 | 960 | 880 | 960 | 3,540 | 260 | 50 | 960 | 16,220 |
| Richmond Hill Doncrest | Richmond Hill | 13.4% | 55.2% | 8.4% | 2.4% | 3.0% | 12.1% | 0.3% | 0.0% | 3,440 | 14,130 | 2,140 | 610 | 780 | 3,090 | 70 | 0 | 1,360 | 22,620 |
| Richmond Hill East | Richmond Hill | 22.4% | 48.6% | 5.4% | 1.7% | 4.1% | 12.5% | 0.7% | 0.3% | 5,960 | 12,940 | 1,440 | 440 | 1,100 | 3,320 | 180 | 80 | 1,160 | 22,560 |
| Richmond Hill North East | Richmond Hill | 27.9% | 30.6% | 8.8% | 4.2% | 5.9% | 17.5% | 0.7% | 0.1% | 5,660 | 6,200 | 1,780 | 860 | 1,190 | 3,560 | 140 | 20 | 880 | 16,820 |
| Richmond Hill North West | Richmond Hill | 43.1% | 21.2% | 4.3% | 1.8% | 4.7% | 16.4% | 0.9% | 0.1% | 15,080 | 7,440 | 1,520 | 620 | 1,660 | 5,740 | 320 | 50 | 2,600 | 26,640 |
| Richmond Hill Richvale | Richmond Hill | 48.5% | 17.0% | 2.9% | 1.4% | 3.9% | 19.5% | 0.7% | 0.2% | 13,920 | 4,890 | 820 | 400 | 1,100 | 5,600 | 190 | 60 | 1,700 | 22,520 |
| Rockcliffe-Smythe | Toronto | 54.0% | 10.3% | 3.2% | 13.2% | 6.1% | 1.1% | 10.0% | 0.7% | 15,290 | 2,930 | 900 | 3,740 | 1,720 | 320 | 2,840 | 190 | 390 | 22,110 |
| Roncesvalles | Toronto | 72.8% | 7.0% | 2.8% | 3.3% | 7.8% | 1.2% | 1.6% | 0.6% | 19,050 | 1,830 | 750 | 870 | 2,040 | 300 | 420 | 170 | 750 | 14,550 |
| Rosedale-Moore Park | Toronto | 75.5% | 5.5% | 2.9% | 1.5% | 6.9% | 2.5% | 1.1% | 0.5% | 26,180 | 1,900 | 990 | 530 | 2,380 | 870 | 400 | 170 | 1,290 | 20,080 |
| Runnymede-Bloor West Village | Toronto | 78.4% | 5.0% | 1.1% | 2.0% | 7.5% | 1.4% | 1.5% | 0.6% | 14,970 | 950 | 220 | 380 | 1,430 | 260 | 290 | 120 | 480 | 10,150 |
| Rustic | Toronto | 36.7% | 8.9% | 4.7% | 34.1% | 5.8% | 0.5% | 7.3% | 0.2% | 3,880 | 940 | 490 | 3,610 | 610 | 50 | 770 | 20 | 210 | 9,390 |
| Scarborough Village | Toronto | 26.5% | 10.3% | 24.8% | 17.9% | 6.1% | 6.0% | 1.0% | 1.2% | 5,500 | 2,140 | 5,140 | 3,710 | 1,270 | 1,250 | 210 | 250 | 1,260 | 16,490 |
| Sheridan | Mississauga | 56.0% | 9.6% | 11.2% | 5.3% | 7.3% | 6.5% | 0.8% | 0.8% | 12,120 | 2,080 | 2,420 | 1,160 | 1,580 | 1,400 | 180 | 160 | 540 | 15,480 |
| Sheridan Park | Mississauga | no data | no data | no data | no data | no data | no data | no data | no data | - | - | - | - | - | - | - | - | - | - |
| Snelgrove-Heart Lake | Brampton | 43.3% | 4.7% | 22.3% | 13.4% | 7.8% | 0.9% | 1.2% | 0.8% | 23,040 | 2,520 | 11,880 | 7,130 | 4,130 | 500 | 640 | 400 | 3,010 | 38,780 |
| South Eglinton-Davisville | Toronto | 56.1% | 10.2% | 8.5% | 4.7% | 4.6% | 6.7% | 4.3% | 0.5% | 19,690 | 3,560 | 2,970 | 1,650 | 1,620 | 2,370 | 1,520 | 170 | 1,550 | 22,610 |
| South Parkdale | Toronto | 55.0% | 14.9% | 5.8% | 9.8% | 5.3% | 2.2% | 2.4% | 1.4% | 17,510 | 4,750 | 1,860 | 3,110 | 1,700 | 700 | 780 | 440 | 1,000 | 20,390 |
| South Riverdale | Toronto | 64.0% | 15.1% | 3.1% | 3.9% | 7.1% | 1.7% | 0.8% | 1.2% | 30,170 | 7,140 | 1,450 | 1,830 | 3,350 | 780 | 360 | 570 | 1,460 | 27,930 |
| South of Maple | Vaughan | 34.7% | 20.4% | 13.9% | 9.0% | 3.5% | 8.9% | 3.4% | 0.2% | 5,920 | 3,480 | 2,370 | 1,530 | 600 | 1,520 | 580 | 40 | 1,040 | 14,100 |
| Southdown Employment Area | Mississauga | no data | no data | no data | no data | no data | no data | no data | no data | - | - | - | - | - | - | - | - | - | - |
| Springdale | Brampton | 8.7% | 4.3% | 51.6% | 13.2% | 3.9% | 1.2% | 0.7% | 0.0% | 9,600 | 4,740 | 56,720 | 14,510 | 4,280 | 1,290 | 820 | 30 | 17,840 | 93,380 |
| St Lawrence-East Bayfront-The Islands | Toronto | 52.5% | 13.5% | 9.4% | 7.5% | 5.1% | 5.2% | 2.5% | 1.2% | 25,210 | 6,490 | 4,500 | 3,630 | 2,450 | 2,500 | 1,220 | 560 | 1,470 | 31,330 |
| St.Andrew-Windfields | Toronto | 41.6% | 24.2% | 5.5% | 3.5% | 5.5% | 10.9% | 1.3% | 0.1% | 9,320 | 5,420 | 1,230 | 790 | 1,240 | 2,440 | 300 | 30 | 1,640 | 17,010 |
| Steeles | Toronto | 9.1% | 69.9% | 6.5% | 4.2% | 2.3% | 3.1% | 0.1% | 0.1% | 2,210 | 16,960 | 1,570 | 1,030 | 560 | 740 | 20 | 20 | 1,180 | 22,820 |
| Stonegate-Queensway | Toronto | 74.8% | 7.0% | 2.6% | 2.2% | 7.0% | 2.0% | 1.6% | 0.8% | 30,100 | 2,820 | 1,060 | 870 | 2,810 | 810 | 650 | 310 | 800 | 25,580 |
| Streetsville | Mississauga | 58.3% | 10.3% | 9.5% | 4.8% | 7.9% | 3.8% | 2.5% | 0.6% | 10,530 | 1,860 | 1,720 | 880 | 1,430 | 690 | 460 | 110 | 380 | 11,950 |
| Tam O'Shanter-Sullivan | Toronto | 24.2% | 37.2% | 14.2% | 7.6% | 4.8% | 6.5% | 0.5% | 0.1% | 7,600 | 11,680 | 4,450 | 2,380 | 1,520 | 2,050 | 160 | 30 | 1,560 | 27,250 |
| Taylor-Massey | Toronto | 38.1% | 8.5% | 28.1% | 9.6% | 5.6% | 2.8% | 2.2% | 1.0% | 7,930 | 1,780 | 5,860 | 2,000 | 1,170 | 590 | 450 | 210 | 830 | 15,320 |
| The Beaches | Toronto | 79.6% | 4.5% | 1.7% | 1.8% | 7.0% | 1.5% | 0.9% | 0.9% | 33,350 | 1,880 | 720 | 770 | 2,920 | 620 | 380 | 360 | 890 | 21,480 |
| The Hill | Richmond Hill | 29.1% | 32.9% | 7.4% | 3.0% | 3.7% | 16.3% | 1.5% | 0.0% | 13,080 | 14,740 | 3,310 | 1,350 | 1,660 | 7,300 | 660 | 20 | 2,740 | 36,600 |
| Thistletown-Beaumond Heights | Toronto | 33.7% | 5.2% | 21.6% | 15.7% | 6.4% | 7.6% | 4.0% | 0.2% | 3,900 | 610 | 2,500 | 1,810 | 740 | 880 | 470 | 30 | 650 | 9,700 |
| Thorncliffe Park | Toronto | 21.3% | 9.6% | 35.0% | 6.5% | 3.9% | 14.2% | 1.7% | 0.1% | 5,180 | 2,330 | 8,520 | 1,570 | 950 | 3,450 | 410 | 30 | 1,920 | 20,410 |
| Thornhill North | Markham | 44.0% | 21.0% | 3.3% | 1.7% | 4.9% | 17.9% | 0.5% | 0.1% | 8,270 | 3,950 | 610 | 320 | 930 | 3,370 | 100 | 10 | 1,220 | 14,460 |
| Thornhill South | Markham | 34.8% | 26.0% | 3.2% | 1.7% | 3.8% | 23.7% | 1.5% | 0.2% | 5,080 | 3,790 | 460 | 260 | 560 | 3,460 | 220 | 40 | 720 | 11,740 |
| Toronto Gore Rural Estate | Brampton | 18.7% | 0.4% | 52.2% | 4.0% | 2.2% | 2.3% | 0.0% | 0.0% | 530 | 10 | 1,470 | 110 | 60 | 70 | 0 | 0 | 570 | 2,360 |
| Trinity-Bellwoods | Toronto | 67.5% | 15.0% | 1.5% | 2.6% | 6.2% | 2.0% | 1.1% | 0.4% | 16,400 | 3,640 | 360 | 620 | 1,500 | 490 | 270 | 90 | 910 | 15,420 |
| Unionville | Markham | 34.2% | 47.0% | 4.8% | 2.2% | 4.8% | 2.3% | 0.5% | 0.1% | 7,540 | 10,360 | 1,060 | 480 | 1,060 | 520 | 120 | 20 | 880 | 17,610 |
| University | Toronto | 64.7% | 14.7% | 2.9% | 1.7% | 6.2% | 1.8% | 2.3% | 0.4% | 6,870 | 1,560 | 310 | 180 | 660 | 190 | 250 | 50 | 570 | 6,450 |
| University of Toronto Mississauga | Mississauga | no data | no data | no data | no data | no data | no data | no data | no data | - | - | - | - | - | - | - | - | - | - |
| Vales of Castlemore | Brampton | 8.0% | 3.1% | 58.1% | 10.4% | 3.3% | 1.5% | 0.0% | 0.0% | 1,540 | 600 | 11,170 | 2,000 | 620 | 290 | 0 | 0 | 2,980 | 16,430 |
| Vales of Castlemore North | Brampton | 17.9% | 2.9% | 49.2% | 7.4% | 3.5% | 0.6% | 0.3% | 0.0% | 1,360 | 220 | 3,740 | 560 | 270 | 40 | 30 | 0 | 1,390 | 6,530 |
| Vales of Humber | Brampton | 1.9% | 1.4% | 64.7% | 5.4% | 2.6% | 2.3% | 0.4% | 0.0% | 170 | 130 | 5,910 | 500 | 240 | 210 | 40 | 0 | 1,940 | 8,010 |
| Victoria Village | Toronto | 38.5% | 12.3% | 13.8% | 11.6% | 5.7% | 12.2% | 2.0% | 0.7% | 8,550 | 2,730 | 3,070 | 2,590 | 1,260 | 2,710 | 450 | 160 | 720 | 17,370 |
| Wellington Place | Toronto | 52.8% | 16.8% | 8.4% | 4.4% | 4.7% | 6.4% | 2.4% | 0.4% | 20,720 | 6,580 | 3,320 | 1,740 | 1,830 | 2,520 | 950 | 140 | 1,460 | 25,530 |
| West Hill | Toronto | 33.2% | 11.7% | 18.3% | 21.5% | 6.6% | 3.0% | 1.1% | 1.4% | 12,140 | 4,290 | 6,690 | 7,840 | 2,410 | 1,110 | 420 | 500 | 1,120 | 28,110 |
| West Humber-Clairville | Toronto | 17.7% | 8.3% | 32.6% | 22.0% | 4.7% | 2.9% | 2.9% | 0.2% | 6,970 | 3,280 | 12,850 | 8,650 | 1,850 | 1,140 | 1,130 | 90 | 3,430 | 33,330 |
| West Queen West | Toronto | 65.4% | 9.7% | 5.0% | 4.7% | 4.8% | 3.1% | 3.3% | 0.9% | 14,870 | 2,200 | 1,130 | 1,080 | 1,100 | 700 | 740 | 210 | 700 | 13,360 |
| West Rouge | Toronto | 38.1% | 10.9% | 19.8% | 18.0% | 6.8% | 2.2% | 0.9% | 0.5% | 11,190 | 3,190 | 5,800 | 5,270 | 2,010 | 660 | 260 | 150 | 820 | 20,690 |
| Western Business Park | Mississauga | no data | no data | no data | no data | no data | no data | no data | no data | - | - | - | - | - | - | - | - | - | - |
| Westminster-Branson | Toronto | 38.2% | 27.8% | 2.3% | 3.5% | 3.8% | 8.7% | 2.1% | 0.0% | 11,810 | 8,610 | 710 | 1,070 | 1,170 | 2,680 | 650 | 0 | 4,250 | 25,730 |
| Weston | Toronto | 40.0% | 8.3% | 3.3% | 32.4% | 6.6% | 1.0% | 5.7% | 1.0% | 9,660 | 2,000 | 800 | 7,810 | 1,590 | 240 | 1,380 | 250 | 400 | 18,650 |
| Weston-Pelham Park | Toronto | 60.0% | 8.8% | 2.5% | 10.8% | 6.4% | 1.1% | 7.2% | 1.4% | 8,880 | 1,300 | 370 | 1,600 | 940 | 170 | 1,060 | 210 | 270 | 10,570 |
| Wexford/Maryvale | Toronto | 39.1% | 16.6% | 13.9% | 8.9% | 6.1% | 9.8% | 1.2% | 0.6% | 14,020 | 5,950 | 4,990 | 3,180 | 2,200 | 3,520 | 430 | 210 | 1,410 | 28,430 |
| Willowdale West | Toronto | 38.3% | 33.4% | 3.7% | 1.7% | 3.0% | 12.7% | 1.0% | 0.1% | 8,150 | 7,110 | 800 | 370 | 650 | 2,700 | 210 | 30 | 1,290 | 17,070 |
| Willowridge-Martingrove-Richview | Toronto | 58.8% | 7.4% | 6.3% | 12.0% | 6.5% | 2.5% | 3.9% | 0.3% | 16,860 | 2,130 | 1,820 | 3,450 | 1,850 | 710 | 1,100 | 80 | 680 | 22,430 |
| Woburn North | Toronto | 21.5% | 16.1% | 34.8% | 11.6% | 4.8% | 3.2% | 0.6% | 0.5% | 6,930 | 5,200 | 11,220 | 3,740 | 1,540 | 1,020 | 210 | 180 | 2,240 | 26,690 |
| Woodbine Corridor | Toronto | 69.6% | 6.9% | 3.0% | 5.1% | 8.4% | 1.2% | 0.9% | 1.8% | 15,800 | 1,570 | 680 | 1,150 | 1,910 | 280 | 220 | 410 | 700 | 12,200 |
| Woodbine-Lumsden | Toronto | 65.9% | 11.2% | 3.6% | 4.8% | 8.4% | 1.6% | 1.3% | 1.0% | 8,560 | 1,450 | 470 | 620 | 1,090 | 210 | 170 | 130 | 290 | 8,010 |
| Woodbridge Centre | Vaughan | 80.3% | 3.6% | 2.8% | 1.3% | 6.1% | 2.4% | 1.2% | 0.0% | 8,540 | 380 | 300 | 140 | 650 | 260 | 120 | 0 | 240 | 8,870 |
| Woodbridge East | Vaughan | 68.4% | 9.1% | 5.7% | 2.9% | 3.9% | 3.6% | 4.2% | 0.0% | 13,160 | 1,740 | 1,100 | 560 | 760 | 700 | 820 | 0 | 420 | 16,620 |
| Woodbridge North | Vaughan | 54.7% | 12.4% | 9.3% | 3.4% | 5.0% | 7.9% | 3.3% | 0.0% | 33,400 | 7,570 | 5,680 | 2,080 | 3,080 | 4,820 | 2,000 | 20 | 2,360 | 51,000 |
| Woodbridge South East | Vaughan | 64.6% | 7.3% | 7.5% | 4.0% | 4.7% | 5.8% | 4.0% | 0.0% | 5,720 | 650 | 660 | 350 | 420 | 520 | 360 | 0 | 180 | 7,120 |
| Woodbridge South West | Vaughan | 65.2% | 4.4% | 9.5% | 4.6% | 4.8% | 4.2% | 3.6% | 0.4% | 14,120 | 950 | 2,070 | 1,000 | 1,040 | 920 | 780 | 80 | 720 | 18,260 |
| Woodbridge West | Vaughan | 70.8% | 2.9% | 7.5% | 3.2% | 6.3% | 4.0% | 2.9% | 0.0% | 3,740 | 160 | 400 | 170 | 340 | 210 | 160 | 0 | 120 | 4,390 |
| Wychwood | Toronto | 66.1% | 8.1% | 1.6% | 5.2% | 6.1% | 2.1% | 3.6% | 0.5% | 14,430 | 1,760 | 360 | 1,140 | 1,330 | 460 | 790 | 100 | 1,460 | 12,790 |
| Yonge-Bay Corridor | Toronto | 35.3% | 29.4% | 10.8% | 4.6% | 2.9% | 8.5% | 2.5% | 0.7% | 5,950 | 4,950 | 1,820 | 770 | 500 | 1,440 | 420 | 120 | 900 | 12,420 |
| Yonge-Doris | Toronto | 20.5% | 44.9% | 9.0% | 1.3% | 1.9% | 15.1% | 1.4% | 0.0% | 4,790 | 10,470 | 2,110 | 300 | 450 | 3,510 | 330 | 10 | 1,350 | 20,120 |
| Yonge-Eglinton | Toronto | 66.7% | 8.1% | 3.2% | 2.5% | 6.1% | 3.3% | 3.2% | 0.9% | 14,800 | 1,800 | 720 | 560 | 1,360 | 740 | 700 | 200 | 1,320 | 12,580 |
| Yonge-St.Clair | Toronto | 72.3% | 5.5% | 2.9% | 2.5% | 5.7% | 3.2% | 1.8% | 0.6% | 15,670 | 1,190 | 640 | 540 | 1,240 | 680 | 380 | 120 | 1,210 | 12,730 |
| York University Heights | Toronto | 23.4% | 23.1% | 13.6% | 19.7% | 4.3% | 5.9% | 5.5% | 0.3% | 7,740 | 7,640 | 4,500 | 6,520 | 1,430 | 1,950 | 1,810 | 80 | 1,370 | 28,440 |
| Yorkdale-Glen Park | Toronto | 49.1% | 17.3% | 6.3% | 10.4% | 4.1% | 1.6% | 7.2% | 0.2% | 9,940 | 3,500 | 1,280 | 2,110 | 830 | 320 | 1,460 | 50 | 770 | 16,650 |
What the map shows
This map shows where the ethnic and cultural origins of Toronto, Mississauga, Brampton, Vaughan, Richmond Hill and Markham are found: for each neighbourhood, the share of all origins its residents reported in each of eight groups, and how many times they were reported. From the 2021 census.
Key findings:
An ethnic or cultural origin is the origin of a person's ancestors, as the person reported it. People could give more than one answer, so the numbers count answers, not people, and add up to more than the residents. Other holds origins that are religious, such as Sikh or Jewish, and a few that fit none of the groups; it is in each neighbourhood's figures but not mapped. The census counts people by census tract, so each neighbourhood's figures are estimated from the tracts it overlaps.
What goes into each group
The census lists 250 origins, and every one is in exactly one group. Largest in the Toronto area first. n.o.s. means not otherwise specified, and n.i.e. not included elsewhere.
European (58 origins): English; Irish; Italian; Scottish; German; Polish; Portuguese; French, n.o.s.; British Isles, n.o.s.; Ukrainian; Russian; Greek; Spanish; Dutch; European, n.o.s.; Caucasian (White), n.o.s.; Hungarian; Welsh; Romanian; Croatian; Serbian; Macedonian; Austrian; Albanian; Eastern European, n.o.s.; Maltese; Swedish; Norwegian; Finnish; Lithuanian; Danish; Czech; Swiss; Slovak; Slovenian; Bulgarian; Belgian; Northern European, n.o.s.; Slavic, n.o.s.; Latvian; Bosnian; Estonian; Byelorussian; Northern Irish; Yugoslavian, n.o.s.; Icelandic; Western European, n.o.s.; Moldovan; Celtic, n.o.s.; Mennonite; Azorean; Czechoslovakian, n.o.s.; Roma; Sicilian; Basque; Flemish; Norman; Breton.
East and Southeast Asian (21 origins): Chinese; Filipino; Vietnamese; Korean; Hong Konger; Japanese; East or Southeast Asian, n.o.s.; Taiwanese; Ilocano; Tibetan; Indonesian; Cambodian (Khmer); Malaysian; Laotian; Thai; Malay; Mongolian; Burmese; Igorot; Singaporean; Karen.
South Asian (16 origins): Indian (India); Pakistani; Punjabi; Sri Lankan; Tamil; South Asian, n.o.s.; Bangladeshi; Gujarati; Bengali; Jatt; Nepali; Goan; Sinhalese; Malayali; Telugu; Kashmiri.
African and Caribbean (52 origins): Jamaican; African, n.o.s.; Guyanese; Trinidadian/Tobagonian; Black, n.o.s.; West Indian, n.o.s.; African Caribbean; Caribbean, n.o.s.; Somali; Nigerian; Ghanaian; Ethiopian; Barbadian; African Canadian; South African; Yoruba; Eritrean; Grenadian; African American; Vincentian; Indo-Caribbean; Indo-Guyanese; Southern or East African, n.o.s.; Haitian; Igbo; Congolese; St. Lucian; Kenyan; Sudanese; Mauritian; Tigrinya; Tanzanian; Akan, n.o.s.; Ugandan; Amhara; Edo; Oromo; Central or West African, n.o.s.; Cameroonian; Zimbabwean; Bantu, n.o.s.; Rwandan; Ivorian; Burundian; African Nova Scotian; Beninese; Senegalese; Fulani; Central African; Malagasy; Bamileke; Guinean.
Canadian and North American (20 origins): Canadian; American; French Canadian; Ontarian; Newfoundlander; Acadian; Québécois; Nova Scotian; United Empire Loyalist; Pennsylvania Dutch; North American, n.o.s.; New Brunswicker; Franco Ontarian; Prince Edward Islander; Cape Bretoner; Gaspesian; Saskatchewanian; Albertan; British Columbian; Manitoban.
Middle Eastern and North African (29 origins): Iranian; Arab, n.o.s.; Afghan; Persian; Egyptian; Turkish; Lebanese; Iraqi; Armenian; West or Central Asian or Middle Eastern, n.o.s.; Syrian; Israeli; Palestinian; Coptic; Assyrian; Moroccan; Kurdish; Azerbaijani; Chaldean; Jordanian; Pashtun; Yemeni; Tajik; North African, n.o.s.; Algerian; Tunisian; Libyan; Berber; Kabyle.
Latin American (20 origins): Latin, Central or South American, n.o.s.; Mexican; Brazilian; Colombian; Ecuadorian; Hispanic, n.o.s.; Salvadorean; Peruvian; Chilean; Cuban; Venezuelan; Argentinian; Dominican; Guatemalan; Nicaraguan; Uruguayan; Mayan; Costa Rican; Honduran; Paraguayan.
Indigenous (24 origins): First Nations (North American Indian), n.o.s.; Métis; North American Indigenous, n.o.s.; Mi'kmaq, n.o.s.; Ojibway; Mohawk; Cree, n.o.s.; Algonquin; Anishinaabe, n.o.s.; Inuit, n.o.s.; Iroquois (Haudenosaunee), n.o.s.; Qalipu Mi'kmaq; Huron (Wendat); Cherokee; Blackfoot, n.o.s.; Innu/Montagnais, n.o.s.; Dene, n.o.s.; Abenaki; Plains Cree; Saulteaux; Oji-Cree; Atikamekw; Woodland Cree; Maliseet.
Other (10 origins): Jewish; Asian, n.o.s.; Hindu; Sikh; Muslim; Christian, n.i.e.; Australian; Buddhist; New Zealander; Fijian.
Sources and licence
Back to the map