| Albion |
Maple Ridge |
9.8% |
68.4% |
21.9% |
290 |
2,010 |
640 |
2,950 |
| Albion Flats |
Maple Ridge |
11.6% |
67.5% |
20.9% |
240 |
1,410 |
440 |
2,090 |
| Albion Industrial |
Maple Ridge |
11.6% |
67.5% |
20.9% |
200 |
1,150 |
360 |
1,710 |
| Aldergrove |
Township of Langley |
14.1% |
66.9% |
19.0% |
1,850 |
8,730 |
2,480 |
13,060 |
| Allco |
Maple Ridge |
13.4% |
67.4% |
19.2% |
170 |
860 |
250 |
1,280 |
| Alouette |
Maple Ridge |
11.8% |
66.9% |
21.3% |
210 |
1,210 |
390 |
1,810 |
| Altamont, Westmount and Bayridge |
West Vancouver |
20.3% |
60.9% |
18.7% |
760 |
2,280 |
700 |
3,740 |
| Ambleside waterfront |
West Vancouver |
38.9% |
52.0% |
9.1% |
2,020 |
2,690 |
470 |
5,180 |
| Annacis Island |
Delta |
no data |
no data |
no data |
- |
- |
- |
- |
| Arbutus Ridge |
Vancouver |
23.9% |
63.9% |
12.2% |
3,560 |
9,510 |
1,810 |
14,890 |
| Austin Heights |
Coquitlam |
16.0% |
74.4% |
9.6% |
550 |
2,560 |
330 |
3,440 |
| Bainbridge |
Burnaby |
21.5% |
63.4% |
15.1% |
470 |
1,380 |
330 |
2,170 |
| Big Bend |
Burnaby |
15.2% |
68.1% |
16.7% |
210 |
940 |
230 |
1,380 |
| Blue Mountain |
Maple Ridge |
14.0% |
67.4% |
18.6% |
600 |
2,870 |
790 |
4,260 |
| Blueridge |
District of North Vancouver |
22.7% |
61.0% |
16.4% |
180 |
470 |
130 |
780 |
| Blundell |
Richmond |
21.7% |
63.9% |
14.4% |
3,940 |
11,590 |
2,620 |
18,150 |
| Boundary |
District of North Vancouver |
19.3% |
62.7% |
18.0% |
340 |
1,120 |
320 |
1,790 |
| Braemar |
District of North Vancouver |
19.5% |
64.6% |
15.9% |
140 |
480 |
120 |
740 |
| Brentwood |
Burnaby |
13.5% |
75.6% |
10.8% |
2,790 |
15,610 |
2,240 |
20,640 |
| Bridgeport |
Richmond |
16.0% |
70.5% |
13.5% |
630 |
2,780 |
530 |
3,940 |
| British Properties |
West Vancouver |
19.4% |
63.7% |
16.9% |
1,010 |
3,320 |
880 |
5,200 |
| Broadmoor |
Richmond |
20.5% |
65.8% |
13.7% |
4,410 |
14,130 |
2,950 |
21,490 |
| Broadview |
Burnaby |
23.3% |
64.5% |
12.2% |
1,610 |
4,480 |
850 |
6,940 |
| Brookswood / Fernridge |
Township of Langley |
22.3% |
61.8% |
15.9% |
3,550 |
9,830 |
2,530 |
15,920 |
| Brow of the Hill |
New Westminster |
12.2% |
76.2% |
11.5% |
1,030 |
6,410 |
970 |
8,410 |
| Brunette Creek |
New Westminster |
15.9% |
70.9% |
13.2% |
680 |
3,020 |
560 |
4,260 |
| Buckingham Heights |
Burnaby |
18.1% |
67.0% |
14.9% |
1,310 |
4,840 |
1,080 |
7,230 |
| Burnaby Mountain |
Burnaby |
11.2% |
72.6% |
16.2% |
980 |
6,300 |
1,410 |
8,680 |
| Burns Bog |
Delta |
38.9% |
51.0% |
10.1% |
140 |
190 |
40 |
370 |
| Canyon Heights |
District of North Vancouver |
16.0% |
65.5% |
18.6% |
400 |
1,630 |
460 |
2,490 |
| Cape Horn |
Coquitlam |
18.1% |
66.6% |
15.2% |
2,310 |
8,470 |
1,940 |
12,710 |
| Capilano |
District of North Vancouver |
22.6% |
60.2% |
17.2% |
740 |
1,970 |
560 |
3,270 |
| Cariboo/Burquitlam |
Coquitlam |
14.9% |
72.8% |
12.4% |
3,820 |
18,680 |
3,170 |
25,670 |
| Carisbrooke |
District of North Vancouver |
19.5% |
65.0% |
15.5% |
770 |
2,580 |
620 |
3,970 |
| Caulfeild, Eagle Harbour and Cypress Park |
West Vancouver |
25.8% |
59.5% |
14.6% |
1,620 |
3,720 |
920 |
6,250 |
| Cedar Village |
City of North Vancouver |
16.1% |
65.9% |
18.1% |
100 |
430 |
120 |
650 |
| Central Coquitlam |
Coquitlam |
18.4% |
66.2% |
15.4% |
2,910 |
10,480 |
2,430 |
15,820 |
| Central Lonsdale |
City of North Vancouver |
19.9% |
68.4% |
11.7% |
2,920 |
10,040 |
1,720 |
14,680 |
| Central Lynn |
District of North Vancouver |
18.0% |
63.7% |
18.3% |
680 |
2,420 |
700 |
3,800 |
| Central Maple Ridge |
Maple Ridge |
18.2% |
66.1% |
15.7% |
1,550 |
5,630 |
1,340 |
8,520 |
| Central Valley |
Burnaby |
21.3% |
65.0% |
13.7% |
2,030 |
6,200 |
1,310 |
9,540 |
| City Centre (Coquitlam) |
Coquitlam |
21.7% |
66.8% |
11.5% |
3,260 |
10,040 |
1,720 |
15,020 |
| City Centre (Richmond) |
Richmond |
20.0% |
69.2% |
10.8% |
12,070 |
41,720 |
6,490 |
60,290 |
| City Centre (Surrey) |
Surrey |
12.2% |
75.0% |
12.8% |
4,610 |
28,240 |
4,810 |
37,660 |
| City of Langley |
City of Langley |
20.0% |
64.7% |
15.3% |
5,860 |
18,890 |
4,470 |
29,220 |
| Clayton |
Surrey |
11.3% |
68.0% |
20.7% |
5,240 |
31,390 |
9,550 |
46,170 |
| Cleveland |
District of North Vancouver |
18.8% |
64.7% |
16.5% |
460 |
1,590 |
410 |
2,460 |
| Cloverdale |
Surrey |
15.0% |
66.9% |
18.1% |
4,440 |
19,890 |
5,380 |
29,710 |
| Connaught Heights |
New Westminster |
16.8% |
72.2% |
11.1% |
210 |
910 |
140 |
1,270 |
| Cottonwood |
Maple Ridge |
11.3% |
68.6% |
20.1% |
1,060 |
6,460 |
1,890 |
9,410 |
| Cove Cliff |
District of North Vancouver |
16.6% |
65.7% |
17.7% |
310 |
1,210 |
330 |
1,840 |
| Deep Cove |
District of North Vancouver |
20.0% |
63.9% |
16.1% |
110 |
370 |
90 |
570 |
| Deer Lake |
Burnaby |
20.9% |
65.5% |
13.6% |
1,390 |
4,380 |
910 |
6,680 |
| Delbrook |
District of North Vancouver |
22.1% |
63.0% |
14.9% |
670 |
1,910 |
450 |
3,030 |
| Dollarton |
District of North Vancouver |
21.1% |
62.8% |
16.1% |
540 |
1,610 |
410 |
2,560 |
| Downtown |
Vancouver |
12.9% |
80.3% |
6.8% |
9,060 |
56,310 |
4,770 |
70,150 |
| Downtown (New Westminster) |
New Westminster |
13.1% |
77.8% |
9.1% |
1,500 |
8,860 |
1,040 |
11,390 |
| Dunbar-Southlands |
Vancouver |
19.5% |
66.9% |
13.6% |
4,010 |
13,740 |
2,790 |
20,540 |
| Dundarave |
West Vancouver |
53.8% |
39.3% |
6.9% |
2,500 |
1,820 |
320 |
4,640 |
| Eagle Ridge |
Coquitlam |
21.2% |
63.5% |
15.3% |
2,070 |
6,220 |
1,500 |
9,790 |
| East Burnaby |
Burnaby |
20.2% |
65.2% |
14.7% |
3,160 |
10,210 |
2,300 |
15,670 |
| East Cambie |
Richmond |
20.5% |
66.6% |
12.9% |
1,950 |
6,330 |
1,230 |
9,510 |
| East Maple Ridge |
Maple Ridge |
11.0% |
68.3% |
20.8% |
220 |
1,400 |
430 |
2,050 |
| East Richmond |
Richmond |
17.6% |
67.5% |
15.0% |
2,580 |
9,930 |
2,200 |
14,710 |
| Edmonds |
Burnaby |
16.1% |
70.3% |
13.6% |
5,640 |
24,550 |
4,760 |
34,950 |
| Fairview |
Vancouver |
19.9% |
71.8% |
8.3% |
6,800 |
24,500 |
2,820 |
34,120 |
| Farmland East |
Delta |
31.7% |
56.2% |
12.0% |
360 |
630 |
140 |
1,120 |
| Farmland West |
Delta |
33.3% |
54.9% |
11.8% |
280 |
460 |
100 |
830 |
| Fleetwood |
Surrey |
16.5% |
67.6% |
15.9% |
8,950 |
36,610 |
8,620 |
54,180 |
| Fort Langley |
Township of Langley |
24.8% |
59.5% |
15.7% |
880 |
2,100 |
560 |
3,530 |
| Fraser Lands |
Richmond |
19.1% |
67.0% |
13.9% |
110 |
400 |
80 |
590 |
| Garden Village |
Burnaby |
19.4% |
68.3% |
12.3% |
1,460 |
5,160 |
930 |
7,550 |
| Gilmore |
Richmond |
24.2% |
60.3% |
15.5% |
1,080 |
2,690 |
690 |
4,470 |
| Glenbrooke North |
New Westminster |
23.7% |
63.5% |
12.8% |
1,020 |
2,730 |
550 |
4,300 |
| Glenbrooke South |
New Westminster |
22.8% |
64.5% |
12.6% |
1,470 |
4,160 |
820 |
6,450 |
| Gloucester |
Township of Langley |
15.1% |
67.1% |
17.8% |
570 |
2,510 |
670 |
3,750 |
| Golden Ears |
Maple Ridge |
10.8% |
67.2% |
22.0% |
350 |
2,180 |
710 |
3,240 |
| Grand Boulevard |
City of North Vancouver |
17.9% |
65.2% |
16.9% |
1,210 |
4,400 |
1,140 |
6,750 |
| Grandview |
Surrey |
15.0% |
65.5% |
19.6% |
5,770 |
25,220 |
7,530 |
38,520 |
| Grandview-Woodland |
Vancouver |
13.8% |
74.7% |
11.5% |
3,850 |
20,800 |
3,200 |
27,860 |
| Grousewoods |
District of North Vancouver |
18.9% |
64.7% |
16.4% |
330 |
1,130 |
290 |
1,750 |
| Guildford |
Surrey |
14.8% |
69.1% |
16.1% |
10,290 |
47,870 |
11,140 |
69,300 |
| Hamilton |
Richmond |
14.0% |
70.4% |
15.6% |
690 |
3,460 |
770 |
4,910 |
| Hammond |
Maple Ridge |
14.2% |
68.2% |
17.6% |
810 |
3,900 |
1,000 |
5,710 |
| Handsworth |
District of North Vancouver |
20.9% |
62.4% |
16.7% |
490 |
1,480 |
400 |
2,370 |
| Hastings-Sunrise |
Vancouver |
18.2% |
69.7% |
12.1% |
6,510 |
24,920 |
4,330 |
35,760 |
| Heights |
Burnaby |
20.7% |
66.0% |
13.3% |
4,280 |
13,650 |
2,750 |
20,680 |
| Highlands |
District of North Vancouver |
18.5% |
63.1% |
18.4% |
560 |
1,900 |
550 |
3,010 |
| Hockaday Nestor |
Coquitlam |
14.7% |
68.9% |
16.4% |
1,450 |
6,820 |
1,620 |
9,890 |
| Holdom |
Burnaby |
15.8% |
71.8% |
12.4% |
1,550 |
7,040 |
1,220 |
9,810 |
| Hollyburn, Ambleside, Sentinel Hill and Cedardale |
West Vancouver |
26.8% |
57.7% |
15.5% |
1,990 |
4,280 |
1,150 |
7,420 |
| Horseshoe Bay, Whytecliff and Gleneagles |
West Vancouver |
25.1% |
60.5% |
14.5% |
940 |
2,260 |
540 |
3,730 |
| Indian Arm Communities |
District of North Vancouver |
24.1% |
61.7% |
14.1% |
410 |
1,050 |
240 |
1,700 |
| Indian River |
District of North Vancouver |
17.2% |
65.4% |
17.4% |
350 |
1,340 |
360 |
2,050 |
| Keith Lynn |
District of North Vancouver |
20.8% |
62.9% |
16.3% |
580 |
1,760 |
460 |
2,800 |
| Kelvin |
New Westminster |
19.0% |
69.8% |
11.2% |
1,020 |
3,730 |
600 |
5,350 |
| Kensington-Cedar Cottage |
Vancouver |
16.1% |
70.7% |
13.2% |
8,220 |
36,040 |
6,730 |
50,980 |
| Kerrisdale |
Vancouver |
21.0% |
66.9% |
12.2% |
3,550 |
11,310 |
2,060 |
16,920 |
| Killarney |
Vancouver |
19.0% |
67.6% |
13.4% |
6,400 |
22,790 |
4,520 |
33,710 |
| Kirkstone |
District of North Vancouver |
19.4% |
63.9% |
16.7% |
240 |
800 |
210 |
1,260 |
| Kitsilano |
Vancouver |
16.0% |
74.1% |
9.9% |
7,100 |
32,840 |
4,400 |
44,340 |
| Ladner |
Delta |
22.5% |
61.9% |
15.6% |
5,090 |
14,010 |
3,530 |
22,630 |
| Lake City |
Burnaby |
18.9% |
65.6% |
15.5% |
770 |
2,680 |
630 |
4,080 |
| Lions Gate |
District of North Vancouver |
19.8% |
66.3% |
13.9% |
150 |
520 |
110 |
780 |
| Lochdale |
Burnaby |
18.9% |
67.8% |
13.3% |
1,530 |
5,510 |
1,080 |
8,120 |
| Lougheed |
Burnaby |
16.6% |
70.7% |
12.7% |
2,300 |
9,770 |
1,750 |
13,820 |
| Lower Capilano Marine |
District of North Vancouver |
19.8% |
66.3% |
13.9% |
170 |
560 |
120 |
840 |
| Lower Lonsdale |
City of North Vancouver |
19.6% |
71.4% |
9.0% |
3,090 |
11,280 |
1,420 |
15,790 |
| Lower West Lynn |
District of North Vancouver |
19.4% |
63.9% |
16.7% |
500 |
1,630 |
430 |
2,560 |
| Lynn Canyon |
District of North Vancouver |
16.2% |
65.0% |
18.8% |
470 |
1,900 |
550 |
2,930 |
| Lynnmour North |
District of North Vancouver |
10.3% |
71.6% |
18.1% |
250 |
1,750 |
440 |
2,440 |
| Lynnmour South |
District of North Vancouver |
10.3% |
71.6% |
18.1% |
170 |
1,170 |
300 |
1,630 |
| Mahon |
City of North Vancouver |
15.4% |
71.4% |
13.3% |
850 |
3,960 |
740 |
5,550 |
| Maillardville |
Coquitlam |
16.4% |
69.3% |
14.4% |
1,510 |
6,390 |
1,320 |
9,220 |
| Maplewood |
District of North Vancouver |
19.3% |
64.7% |
15.9% |
540 |
1,800 |
440 |
2,770 |
| Marine-Hamilton |
City of North Vancouver |
11.5% |
72.7% |
15.8% |
550 |
3,440 |
750 |
4,730 |
| Marpole |
Vancouver |
17.1% |
72.0% |
10.9% |
4,410 |
18,540 |
2,810 |
25,760 |
| Mayfair/Pacific Reach |
Coquitlam |
18.8% |
65.5% |
15.7% |
30 |
110 |
30 |
170 |
| McCartney Woods |
District of North Vancouver |
22.7% |
61.0% |
16.4% |
60 |
170 |
40 |
270 |
| Metrotown |
Burnaby |
17.1% |
72.5% |
10.4% |
5,990 |
25,330 |
3,630 |
34,950 |
| Milner |
Township of Langley |
21.7% |
61.7% |
16.5% |
80 |
220 |
60 |
360 |
| Montecito |
Burnaby |
19.7% |
66.0% |
14.3% |
2,120 |
7,080 |
1,530 |
10,730 |
| Moodyville |
City of North Vancouver |
13.2% |
72.7% |
14.1% |
830 |
4,580 |
890 |
6,300 |
| Mount Pleasant |
Vancouver |
9.9% |
80.4% |
9.7% |
3,300 |
26,700 |
3,210 |
33,220 |
| Murrayville |
Township of Langley |
27.1% |
58.1% |
14.8% |
3,030 |
6,500 |
1,650 |
11,180 |
| Musqueam (Musqueam 2) |
Musqueam |
19.7% |
65.5% |
14.8% |
320 |
1,080 |
240 |
1,650 |
| Musqueam Reserve |
Delta |
no data |
no data |
no data |
- |
- |
- |
- |
| Newton |
Surrey |
13.6% |
69.2% |
17.2% |
22,280 |
113,590 |
28,220 |
164,090 |
| Norgate |
District of North Vancouver |
19.8% |
66.3% |
13.9% |
930 |
3,110 |
650 |
4,690 |
| North Arm North |
New Westminster |
18.0% |
72.3% |
9.7% |
890 |
3,580 |
480 |
4,960 |
| North Arm South |
New Westminster |
10.1% |
72.8% |
17.1% |
530 |
3,820 |
900 |
5,250 |
| North Delta |
Delta |
16.1% |
68.4% |
15.6% |
9,680 |
41,220 |
9,390 |
60,290 |
| Northeast Coquitlam |
Coquitlam |
9.0% |
68.2% |
22.8% |
1,500 |
11,380 |
3,810 |
16,680 |
| Northlands |
District of North Vancouver |
22.6% |
61.0% |
16.4% |
260 |
700 |
190 |
1,150 |
| Northwest Langley |
Township of Langley |
22.9% |
60.6% |
16.5% |
1,000 |
2,650 |
720 |
4,370 |
| Norwood Queens |
District of North Vancouver |
22.2% |
63.2% |
14.6% |
550 |
1,560 |
360 |
2,460 |
| Oakridge |
Vancouver |
20.9% |
67.1% |
12.0% |
3,420 |
10,960 |
1,960 |
16,340 |
| Panorama, Canterbury, Chartwell and Whitby Estates |
West Vancouver |
22.0% |
63.1% |
14.9% |
1,760 |
5,040 |
1,190 |
7,980 |
| Parkgate |
District of North Vancouver |
22.6% |
61.0% |
16.4% |
50 |
140 |
40 |
220 |
| Parkway |
District of North Vancouver |
19.6% |
64.5% |
15.8% |
80 |
260 |
60 |
410 |
| Pemberton Heights |
District of North Vancouver |
19.8% |
66.3% |
13.9% |
430 |
1,420 |
300 |
2,140 |
| Pitt Meadows |
Pitt Meadows |
18.1% |
64.7% |
17.1% |
3,540 |
12,640 |
3,340 |
19,520 |
| Port Coquitlam |
Port Coquitlam |
15.7% |
68.6% |
15.6% |
9,660 |
42,200 |
9,610 |
61,480 |
| Port Moody |
Port Moody |
14.4% |
69.1% |
16.4% |
4,840 |
23,150 |
5,510 |
33,500 |
| Queens Park |
New Westminster |
19.3% |
67.7% |
13.0% |
690 |
2,420 |
460 |
3,570 |
| Queensborough |
New Westminster |
10.1% |
71.6% |
18.3% |
590 |
4,150 |
1,060 |
5,790 |
| Ranch Park |
Coquitlam |
16.8% |
67.7% |
15.6% |
1,280 |
5,170 |
1,190 |
7,640 |
| Renfrew-Collingwood |
Vancouver |
17.0% |
72.0% |
11.1% |
9,080 |
38,490 |
5,910 |
53,490 |
| Riley Park |
Vancouver |
16.5% |
69.5% |
14.1% |
3,930 |
16,590 |
3,360 |
23,890 |
| River Heights |
Coquitlam |
19.2% |
64.9% |
16.0% |
690 |
2,330 |
570 |
3,590 |
| Riverside East |
District of North Vancouver |
22.7% |
61.0% |
16.4% |
150 |
410 |
110 |
670 |
| Riverside West |
District of North Vancouver |
10.7% |
71.2% |
18.0% |
60 |
400 |
100 |
560 |
| Roberts Bank Superport |
Delta |
no data |
no data |
no data |
- |
- |
- |
- |
| Roche Point |
District of North Vancouver |
21.1% |
62.7% |
16.1% |
120 |
340 |
90 |
550 |
| Rothsay |
Maple Ridge |
12.8% |
68.0% |
19.2% |
200 |
1,070 |
300 |
1,570 |
| Royal Oak |
Burnaby |
16.9% |
69.9% |
13.2% |
2,600 |
10,790 |
2,030 |
15,420 |
| Ruskin |
Maple Ridge |
15.4% |
65.8% |
18.8% |
230 |
1,000 |
290 |
1,520 |
| Salmon River Uplands |
Township of Langley |
21.3% |
63.5% |
15.3% |
3,780 |
11,250 |
2,710 |
17,740 |
| Sapperton |
New Westminster |
13.0% |
73.4% |
13.6% |
500 |
2,800 |
520 |
3,810 |
| Sea Island |
Richmond |
13.9% |
69.1% |
17.0% |
110 |
570 |
140 |
820 |
| Seafair |
Richmond |
21.3% |
64.9% |
13.8% |
3,420 |
10,430 |
2,220 |
16,080 |
| Seymour Creek Reserve |
District of North Vancouver |
10.4% |
72.3% |
17.4% |
50 |
360 |
90 |
500 |
| Seymour Heights |
District of North Vancouver |
22.6% |
61.0% |
16.4% |
130 |
360 |
100 |
580 |
| Seymour Non-Residential |
District of North Vancouver |
23.0% |
61.1% |
15.9% |
1,070 |
2,850 |
740 |
4,660 |
| Shaughnessy |
Vancouver |
20.8% |
66.1% |
13.1% |
1,860 |
5,910 |
1,170 |
8,950 |
| Shellmont |
Richmond |
19.0% |
66.5% |
14.4% |
1,620 |
5,660 |
1,230 |
8,510 |
| Silver Valley |
Maple Ridge |
10.8% |
67.2% |
22.0% |
150 |
910 |
300 |
1,350 |
| Smith |
Maple Ridge |
11.6% |
68.2% |
20.2% |
20 |
130 |
40 |
190 |
| South Alouette |
Maple Ridge |
18.7% |
65.6% |
15.7% |
1,240 |
4,360 |
1,040 |
6,640 |
| South Arm Islands |
Richmond |
24.2% |
60.3% |
15.5% |
300 |
740 |
190 |
1,230 |
| South Cambie |
Vancouver |
17.8% |
69.4% |
12.8% |
1,640 |
6,390 |
1,180 |
9,210 |
| South Delta |
Delta |
28.7% |
57.3% |
14.0% |
6,350 |
12,690 |
3,100 |
22,140 |
| South Slope |
Burnaby |
18.8% |
67.9% |
13.3% |
1,890 |
6,810 |
1,330 |
10,030 |
| South Surrey |
Surrey |
28.9% |
57.2% |
14.0% |
15,190 |
30,100 |
7,340 |
52,620 |
| Spilsbury |
Maple Ridge |
12.9% |
66.9% |
20.2% |
220 |
1,160 |
350 |
1,730 |
| Squamish Nation (Capilano 5) |
Squamish Nation |
21.6% |
68.3% |
10.2% |
620 |
1,980 |
300 |
2,900 |
| Squamish Nation (Mission IR 1) |
City of North Vancouver |
16.4% |
71.3% |
12.2% |
90 |
410 |
70 |
570 |
| Steveston |
Richmond |
22.8% |
61.8% |
15.4% |
4,300 |
11,650 |
2,900 |
18,860 |
| Strathcona |
Vancouver |
18.0% |
73.0% |
9.0% |
3,130 |
12,700 |
1,570 |
17,400 |
| Sunset |
Vancouver |
17.0% |
70.5% |
12.4% |
5,840 |
24,170 |
4,250 |
34,270 |
| Tempe |
City of North Vancouver |
16.6% |
66.1% |
17.3% |
300 |
1,200 |
310 |
1,810 |
| Thompson |
Richmond |
18.9% |
66.9% |
14.2% |
2,870 |
10,140 |
2,150 |
15,160 |
| Thornhill |
Maple Ridge |
15.2% |
65.8% |
19.0% |
170 |
750 |
220 |
1,140 |
| Tilbury |
Delta |
32.5% |
54.7% |
12.7% |
250 |
420 |
100 |
770 |
| Town Centre |
Maple Ridge |
27.3% |
61.5% |
11.3% |
2,380 |
5,360 |
980 |
8,720 |
| Tsawwassen Ferry Terminal |
Delta |
no data |
no data |
no data |
- |
- |
- |
- |
| Tsawwassen First Nation |
Delta |
18.3% |
66.9% |
14.8% |
400 |
1,450 |
320 |
2,170 |
| Tsleil-Waututh |
District of North Vancouver |
16.4% |
67.6% |
16.0% |
390 |
1,600 |
380 |
2,370 |
| UBC and University Endowment Lands |
UBC and UEL |
11.3% |
74.0% |
14.7% |
2,070 |
13,480 |
2,670 |
18,220 |
| Upper Delbrook |
District of North Vancouver |
21.3% |
63.8% |
14.9% |
320 |
970 |
230 |
1,520 |
| Upper Lynn |
District of North Vancouver |
15.6% |
66.0% |
18.4% |
610 |
2,590 |
720 |
3,920 |
| Upper West Lynn |
District of North Vancouver |
19.4% |
63.9% |
16.7% |
250 |
820 |
210 |
1,280 |
| Uptown |
New Westminster |
21.7% |
68.5% |
9.9% |
1,300 |
4,110 |
590 |
6,000 |
| Valley Centre |
District of North Vancouver |
18.6% |
63.6% |
17.8% |
490 |
1,670 |
470 |
2,620 |
| Victoria-Fraserview |
Vancouver |
21.5% |
66.7% |
11.9% |
6,450 |
20,030 |
3,570 |
30,040 |
| Victory Heights |
New Westminster |
15.9% |
67.9% |
16.2% |
560 |
2,380 |
570 |
3,510 |
| Walnut Grove |
Township of Langley |
19.7% |
62.6% |
17.7% |
3,800 |
12,050 |
3,410 |
19,260 |
| Websters Corners |
Maple Ridge |
11.0% |
68.3% |
20.7% |
460 |
2,820 |
860 |
4,140 |
| West Cambie |
Richmond |
16.3% |
69.8% |
14.0% |
1,830 |
7,830 |
1,570 |
11,220 |
| West End |
Vancouver |
16.6% |
78.1% |
5.4% |
7,840 |
36,960 |
2,530 |
47,330 |
| West Lynn Terrace |
District of North Vancouver |
19.4% |
63.9% |
16.7% |
470 |
1,550 |
400 |
2,420 |
| West Maple Ridge |
Maple Ridge |
19.2% |
64.7% |
16.2% |
3,070 |
10,360 |
2,590 |
16,020 |
| West Point Grey |
Vancouver |
21.3% |
66.5% |
12.2% |
2,820 |
8,810 |
1,610 |
13,240 |
| Westend |
New Westminster |
15.4% |
70.1% |
14.5% |
730 |
3,330 |
690 |
4,750 |
| Westham Island |
Delta |
38.9% |
51.0% |
10.1% |
70 |
90 |
20 |
180 |
| Westview |
City of North Vancouver |
18.2% |
68.0% |
13.8% |
390 |
1,440 |
290 |
2,120 |
| Westwood Plateau |
Coquitlam |
15.2% |
70.1% |
14.7% |
2,920 |
13,450 |
2,810 |
19,180 |
| Whalley |
Surrey |
13.7% |
71.2% |
15.1% |
10,460 |
54,160 |
11,460 |
76,090 |
| Whispering Falls |
Maple Ridge |
15.8% |
67.5% |
16.7% |
50 |
200 |
50 |
300 |
| White Rock |
White Rock |
37.3% |
53.7% |
9.0% |
8,140 |
11,710 |
1,960 |
21,810 |
| Whonnock |
Maple Ridge |
15.3% |
65.8% |
19.0% |
440 |
1,880 |
540 |
2,850 |
| Willoughby |
Township of Langley |
9.3% |
68.8% |
21.9% |
3,360 |
24,780 |
7,870 |
36,010 |
| Willowbrook |
Township of Langley |
14.3% |
65.9% |
19.8% |
990 |
4,580 |
1,370 |
6,940 |
| Windridge |
District of North Vancouver |
19.7% |
64.5% |
15.8% |
80 |
270 |
70 |
420 |
| Windsor Park |
District of North Vancouver |
19.7% |
64.5% |
15.8% |
160 |
520 |
130 |
800 |
| Yennadon |
Maple Ridge |
15.0% |
68.4% |
16.6% |
250 |
1,140 |
280 |
1,670 |
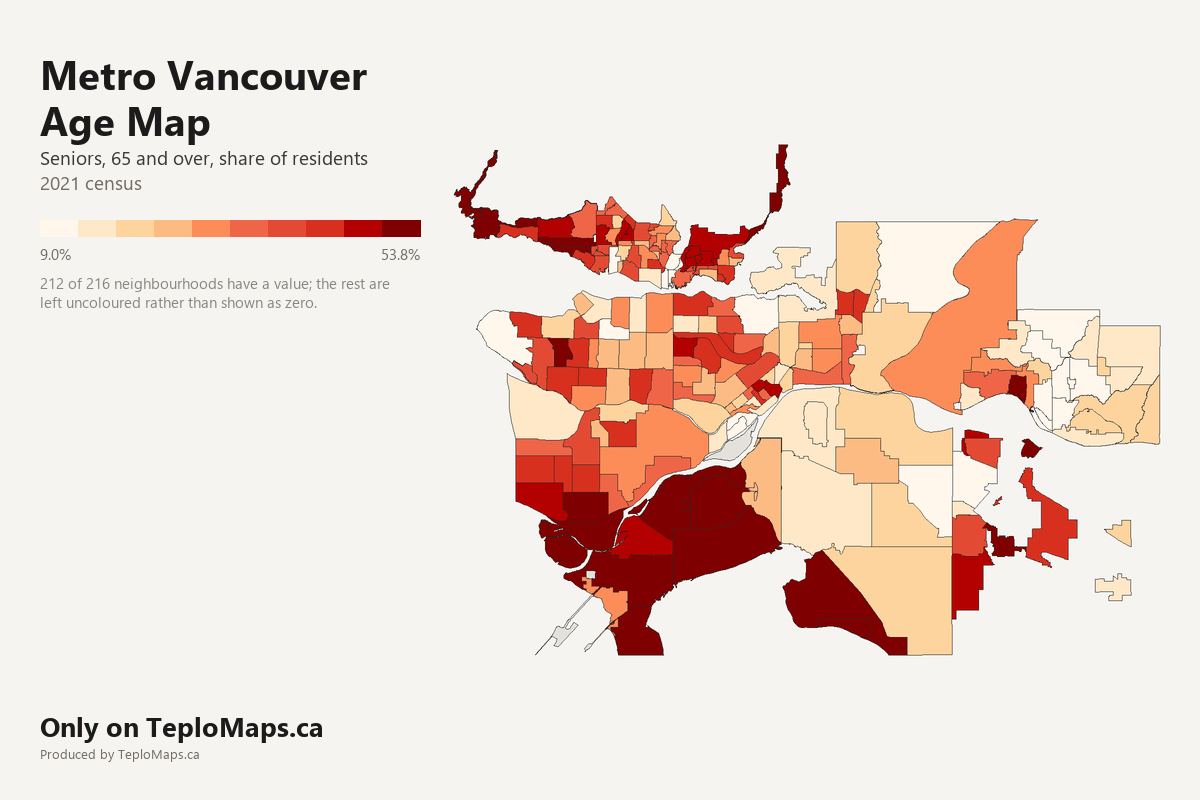
What the map shows
This map shows how old Metro Vancouver's neighbourhoods are, from West Vancouver and the North Shore to Surrey, Langley and Maple Ridge: the share of residents who are seniors, adults and children, based on the 2021 census.
Key findings:
Seniors are 65 and over, adults 15 to 64 and children 0 to 14, the census's own age groups.
Sources and licence
Back to the map