Every neighbourhood in Metro Toronto, by seniors (65+)
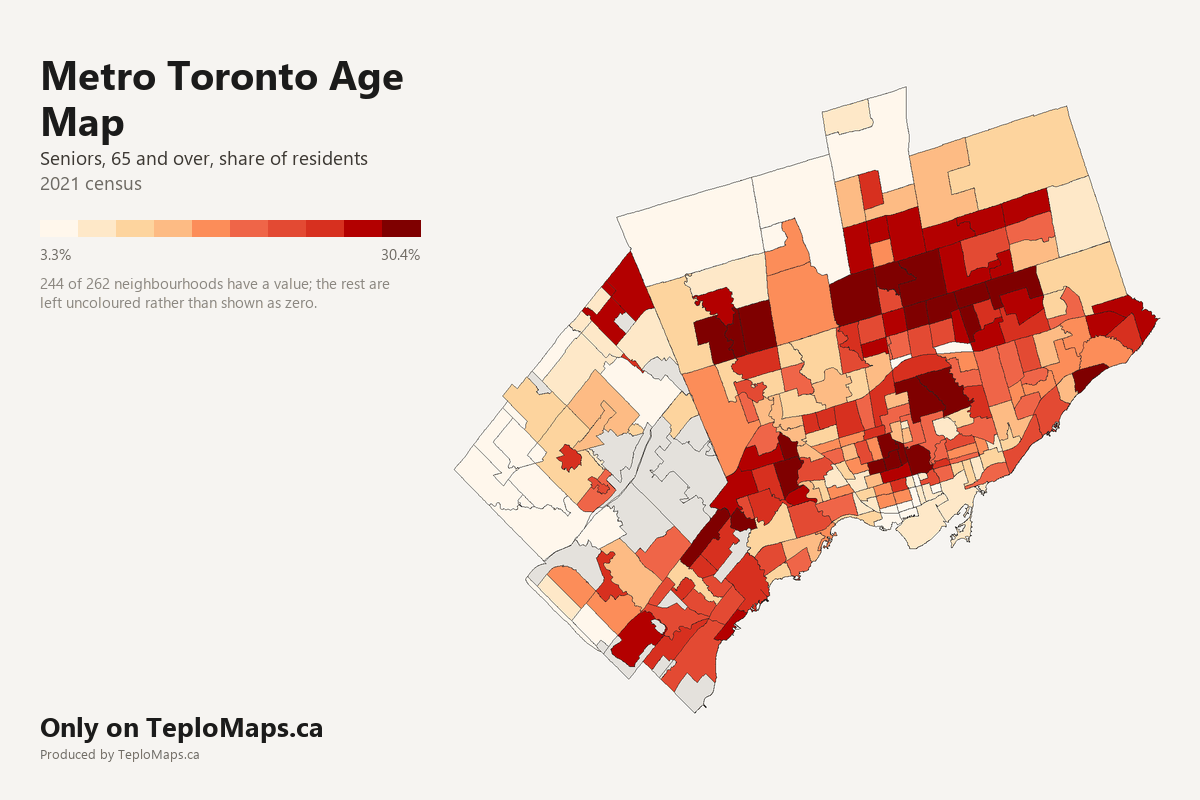
Show the figures for all 262 neighbourhoods
| Neighbourhood | City | Seniors (65+) | Adults (15 to 64) | Children (0 to 14) | Seniors (65+), estimated | Adults (15 to 64), estimated | Children (0 to 14), estimated | Residents, estimated |
|---|---|---|---|---|---|---|---|---|
| Agincourt North | Toronto | 24.0% | 63.8% | 12.3% | 6,520 | 17,330 | 3,330 | 27,180 |
| Agincourt South-Malvern West | Toronto | 19.3% | 68.4% | 12.3% | 4,730 | 16,780 | 3,020 | 24,530 |
| Airport | Mississauga | no data | no data | no data | - | - | - | - |
| Airport Intermodal Area | Brampton | 10.5% | 72.0% | 17.5% | 10 | 80 | 20 | 110 |
| Alderwood | Toronto | 18.1% | 65.7% | 16.2% | 2,270 | 8,250 | 2,030 | 12,550 |
| Annex | Toronto | 21.9% | 70.2% | 8.0% | 6,690 | 21,490 | 2,430 | 30,620 |
| Applewood | Mississauga | 19.2% | 65.0% | 15.8% | 7,020 | 23,770 | 5,770 | 36,560 |
| Around Maple | Vaughan | 10.0% | 68.2% | 21.8% | 6,240 | 42,770 | 13,670 | 62,680 |
| Avondale | Toronto | 10.0% | 78.8% | 11.2% | 1,380 | 10,860 | 1,540 | 13,780 |
| Banbury-Don Mills | Toronto | 26.1% | 61.2% | 12.7% | 7,180 | 16,840 | 3,480 | 27,500 |
| Bathurst Manor | Toronto | 18.6% | 67.3% | 14.1% | 2,990 | 10,850 | 2,270 | 16,110 |
| Bay-Cloverhill | Toronto | 12.1% | 83.4% | 4.4% | 2,130 | 14,620 | 780 | 17,530 |
| Bayview Village | Toronto | 18.8% | 70.6% | 10.6% | 4,250 | 15,950 | 2,390 | 22,600 |
| Bayview Woods-Steeles | Toronto | 30.4% | 59.0% | 10.6% | 3,800 | 7,380 | 1,320 | 12,500 |
| Bedford Park-Nortown | Toronto | 19.9% | 62.2% | 17.8% | 4,480 | 14,000 | 4,010 | 22,500 |
| Beechborough-Greenbrook | Toronto | 16.7% | 67.2% | 16.1% | 1,080 | 4,360 | 1,040 | 6,480 |
| Bendale South | Toronto | 17.4% | 67.8% | 14.8% | 1,900 | 7,380 | 1,610 | 10,890 |
| Bendale-Glen Andrew | Toronto | 19.0% | 66.8% | 14.1% | 3,620 | 12,720 | 2,690 | 19,030 |
| Birchcliffe-Cliffside | Toronto | 18.9% | 66.2% | 14.9% | 4,410 | 15,450 | 3,480 | 23,340 |
| Black Creek | Toronto | 14.8% | 66.4% | 18.8% | 3,160 | 14,130 | 4,000 | 21,290 |
| Blake-Jones | Toronto | 14.0% | 69.2% | 16.8% | 1,040 | 5,150 | 1,250 | 7,440 |
| Bram East | Brampton | 10.9% | 70.8% | 18.4% | 5,980 | 38,970 | 10,130 | 55,080 |
| Bram West | Brampton | 10.5% | 69.8% | 19.7% | 2,410 | 16,100 | 4,550 | 23,070 |
| Bramalea | Brampton | 15.6% | 68.7% | 15.7% | 10,580 | 46,630 | 10,640 | 67,850 |
| Brampton Flowertown | Brampton | 13.9% | 70.2% | 15.9% | 14,950 | 75,730 | 17,150 | 107,830 |
| Brampton Mobility Hub | Brampton | 13.2% | 70.8% | 16.0% | 220 | 1,190 | 270 | 1,680 |
| Brampton South | Brampton | no data | no data | no data | - | - | - | - |
| Briar Hill-Belgravia | Toronto | 16.3% | 70.6% | 13.1% | 2,370 | 10,270 | 1,900 | 14,540 |
| Bridle Path-Sunnybrook-York Mills | Toronto | 28.1% | 58.1% | 13.8% | 2,790 | 5,760 | 1,370 | 9,930 |
| Broadview North | Toronto | 17.4% | 69.3% | 13.3% | 1,960 | 7,780 | 1,500 | 11,230 |
| Brookhaven-Amesbury | Toronto | 13.9% | 68.6% | 17.5% | 2,430 | 11,970 | 3,050 | 17,450 |
| Buttonville | Markham | 21.4% | 65.7% | 12.9% | 3,940 | 12,120 | 2,380 | 18,450 |
| Cabbagetown-South St.James Town | Toronto | 19.0% | 72.9% | 8.1% | 2,140 | 8,200 | 910 | 11,240 |
| Caledonia-Fairbank | Toronto | 15.1% | 70.6% | 14.3% | 1,510 | 7,100 | 1,440 | 10,050 |
| Casa Loma | Toronto | 26.7% | 63.0% | 10.3% | 3,010 | 7,100 | 1,150 | 11,260 |
| Centennial Scarborough | Toronto | 20.7% | 63.3% | 15.9% | 2,790 | 8,520 | 2,140 | 13,450 |
| Central Erin Mills | Mississauga | 16.2% | 68.8% | 15.0% | 5,930 | 25,150 | 5,490 | 36,570 |
| Church-Wellesley | Toronto | 9.7% | 86.0% | 4.4% | 2,170 | 19,290 | 980 | 22,430 |
| Churchill Meadows | Mississauga | 9.2% | 72.0% | 18.8% | 4,430 | 34,750 | 9,090 | 48,270 |
| Churchill Meadows Employment Area | Mississauga | no data | no data | no data | - | - | - | - |
| Clairlea-Birchmount | Toronto | 15.2% | 68.5% | 16.3% | 4,180 | 18,860 | 4,480 | 27,520 |
| Clairville Conservation | Brampton | no data | no data | no data | - | - | - | - |
| Clanton Park | Toronto | 14.4% | 69.5% | 16.1% | 2,540 | 12,240 | 2,840 | 17,630 |
| Clarkson - Lorne Park | Mississauga | 18.9% | 65.8% | 15.3% | 7,390 | 25,710 | 5,980 | 39,080 |
| Clarkson Employment Area | Mississauga | no data | no data | no data | - | - | - | - |
| Cliffcrest | Toronto | 18.4% | 66.1% | 15.5% | 3,000 | 10,820 | 2,540 | 16,360 |
| Concord-Vaughan | Vaughan | 24.9% | 61.9% | 13.2% | 14,030 | 34,840 | 7,460 | 56,320 |
| Cooksville | Mississauga | 19.0% | 66.2% | 14.8% | 5,180 | 18,090 | 4,040 | 27,320 |
| Cornell | Markham | 11.1% | 67.2% | 21.7% | 3,420 | 20,640 | 6,660 | 30,740 |
| Corso Italia-Davenport | Toronto | 15.8% | 70.3% | 13.9% | 2,100 | 9,340 | 1,840 | 13,280 |
| Countryside Villages | Brampton | 7.7% | 67.4% | 24.9% | 540 | 4,720 | 1,740 | 7,010 |
| Credit Valley | Brampton | 9.0% | 69.9% | 21.1% | 3,740 | 28,930 | 8,730 | 41,400 |
| Creditview | Mississauga | 19.1% | 68.3% | 12.6% | 1,840 | 6,600 | 1,220 | 9,660 |
| Danforth | Toronto | 17.8% | 65.5% | 16.7% | 1,660 | 6,120 | 1,560 | 9,340 |
| Danforth East York | Toronto | 16.6% | 65.3% | 18.0% | 2,840 | 11,170 | 3,080 | 17,100 |
| Dixie Employment Area | Mississauga | no data | no data | no data | - | - | - | - |
| Don Valley Village | Toronto | 18.9% | 66.9% | 14.2% | 5,110 | 18,040 | 3,830 | 26,980 |
| Dorset Park | Toronto | 17.1% | 67.6% | 15.3% | 4,230 | 16,720 | 3,780 | 24,740 |
| Dovercourt Village | Toronto | 15.4% | 73.3% | 11.2% | 1,920 | 9,110 | 1,400 | 12,420 |
| Downsview | Toronto | 15.0% | 70.3% | 14.8% | 2,720 | 12,740 | 2,680 | 18,140 |
| Downtown | Mississauga | 14.8% | 69.7% | 15.5% | 9,890 | 46,480 | 10,360 | 66,730 |
| Downtown Brampton | Brampton | 20.9% | 65.8% | 13.2% | 2,420 | 7,610 | 1,530 | 11,560 |
| Downtown Yonge East | Toronto | 11.0% | 83.5% | 5.5% | 2,000 | 15,240 | 1,000 | 18,240 |
| Dufferin Grove | Toronto | 14.4% | 74.8% | 10.8% | 1,620 | 8,450 | 1,220 | 11,300 |
| East Credit | Mississauga | 15.1% | 71.0% | 13.9% | 9,630 | 45,240 | 8,880 | 63,750 |
| East End-Danforth | Toronto | 14.2% | 68.8% | 17.0% | 3,110 | 15,040 | 3,720 | 21,860 |
| East L'Amoreaux | Toronto | 20.4% | 66.1% | 13.5% | 4,370 | 14,190 | 2,910 | 21,470 |
| East Willowdale | Toronto | 17.8% | 67.9% | 14.2% | 2,780 | 10,580 | 2,220 | 15,570 |
| Edenbridge-Humber Valley | Toronto | 24.3% | 62.4% | 13.4% | 3,750 | 9,650 | 2,070 | 15,470 |
| Eglinton East | Toronto | 16.7% | 66.7% | 16.6% | 3,810 | 15,190 | 3,780 | 22,790 |
| Elms-Old Rexdale | Toronto | 14.9% | 67.9% | 17.2% | 1,400 | 6,390 | 1,620 | 9,400 |
| Englemount-Lawrence | Toronto | 17.4% | 62.5% | 20.1% | 3,740 | 13,450 | 4,320 | 21,500 |
| Erin Mills | Mississauga | 21.7% | 63.9% | 14.4% | 9,550 | 28,140 | 6,330 | 44,020 |
| Erindale | Mississauga | 18.1% | 67.1% | 14.8% | 3,990 | 14,750 | 3,250 | 21,990 |
| Eringate-Centennial-West Deane | Toronto | 21.7% | 64.0% | 14.3% | 4,010 | 11,810 | 2,630 | 18,440 |
| Etobicoke City Centre | Toronto | 13.4% | 74.9% | 11.7% | 3,180 | 17,790 | 2,770 | 23,740 |
| Etobicoke West Mall | Toronto | 18.5% | 67.0% | 14.6% | 2,260 | 8,190 | 1,780 | 12,240 |
| Fairview | Mississauga | 19.2% | 68.1% | 12.7% | 1,320 | 4,700 | 880 | 6,910 |
| Fenside-Parkwoods | Toronto | 15.8% | 69.8% | 14.5% | 3,230 | 14,300 | 2,970 | 20,500 |
| Flemingdon Park | Toronto | 14.4% | 67.1% | 18.5% | 3,220 | 15,050 | 4,150 | 22,430 |
| Fletcher's Creek South | Brampton | 17.8% | 69.2% | 13.0% | 4,640 | 17,980 | 3,370 | 25,980 |
| Fletcher's Creek Village | Brampton | 9.9% | 72.7% | 17.4% | 960 | 7,060 | 1,690 | 9,710 |
| Fletcher's Meadow | Brampton | 8.7% | 71.6% | 19.8% | 4,670 | 38,560 | 10,660 | 53,890 |
| Forest Hill North | Toronto | 19.5% | 65.3% | 15.2% | 2,400 | 8,030 | 1,870 | 12,310 |
| Forest Hill South | Toronto | 25.9% | 62.2% | 11.9% | 2,900 | 6,980 | 1,340 | 11,220 |
| Fort York-Liberty Village | Toronto | 4.1% | 89.9% | 6.0% | 810 | 17,890 | 1,200 | 19,900 |
| Gateway Employment Area | Mississauga | no data | no data | no data | - | - | - | - |
| Glenfield-Jane Heights | Toronto | 17.5% | 66.0% | 16.4% | 5,270 | 19,840 | 4,940 | 30,050 |
| Golfdale-Cedarbrae-Woburn | Toronto | 16.6% | 65.7% | 17.6% | 4,570 | 18,070 | 4,850 | 27,490 |
| Gore Meadows | Brampton | no data | no data | no data | - | - | - | - |
| Goreway Drive Corridor | Brampton | 19.9% | 67.6% | 12.5% | 500 | 1,690 | 310 | 2,510 |
| Greenwood-Coxwell | Toronto | 13.3% | 68.7% | 18.0% | 1,880 | 9,720 | 2,550 | 14,150 |
| Guildwood | Toronto | 27.3% | 59.1% | 13.6% | 2,670 | 5,790 | 1,330 | 9,790 |
| Harbourfront-CityPlace | Toronto | 5.4% | 87.2% | 7.3% | 1,520 | 24,510 | 2,060 | 28,100 |
| Heart Lake | Brampton | no data | no data | no data | - | - | - | - |
| Henry Farm | Toronto | 9.3% | 76.3% | 14.4% | 1,860 | 15,190 | 2,870 | 19,910 |
| Heritage Heights | Brampton | 7.5% | 68.6% | 23.9% | 20 | 160 | 50 | 230 |
| High Park North | Toronto | 16.1% | 71.2% | 12.6% | 3,560 | 15,760 | 2,790 | 22,110 |
| High Park-Swansea | Toronto | 17.4% | 67.9% | 14.7% | 4,020 | 15,720 | 3,410 | 23,150 |
| Highland Creek | Toronto | 22.6% | 65.6% | 11.8% | 2,880 | 8,330 | 1,490 | 12,710 |
| Highway 410 and Steeles | Brampton | no data | no data | no data | - | - | - | - |
| Highway 427 Industrial | Brampton | 24.0% | 63.4% | 12.6% | 130 | 340 | 70 | 540 |
| Hillcrest Village | Toronto | 28.6% | 59.5% | 11.9% | 4,730 | 9,840 | 1,960 | 16,530 |
| Humber Bay Shores | Toronto | 15.8% | 76.7% | 7.5% | 3,560 | 17,270 | 1,700 | 22,530 |
| Humber Heights-Westmount | Toronto | 26.8% | 60.1% | 13.1% | 2,810 | 6,300 | 1,380 | 10,480 |
| Humber Summit | Toronto | 19.7% | 65.2% | 15.1% | 2,420 | 7,990 | 1,850 | 12,260 |
| Humbermede | Toronto | 14.2% | 68.0% | 17.8% | 2,390 | 11,430 | 3,000 | 16,820 |
| Humewood-Cedarvale | Toronto | 16.1% | 68.7% | 15.2% | 2,250 | 9,590 | 2,120 | 13,960 |
| Hurontario | Mississauga | 17.5% | 68.9% | 13.6% | 10,640 | 41,970 | 8,280 | 60,900 |
| Hurontario-Main Corridor | Brampton | 19.0% | 68.0% | 13.0% | 1,090 | 3,890 | 740 | 5,710 |
| Huttonville | Brampton | 9.0% | 69.7% | 21.3% | 150 | 1,140 | 350 | 1,640 |
| Ionview | Toronto | 15.7% | 67.8% | 16.5% | 2,100 | 9,090 | 2,220 | 13,420 |
| Islington | Toronto | 20.7% | 64.8% | 14.5% | 4,920 | 15,370 | 3,440 | 23,730 |
| Junction Area | Toronto | 12.7% | 72.9% | 14.5% | 1,800 | 10,330 | 2,050 | 14,170 |
| Junction-Wallace Emerson | Toronto | 13.1% | 73.8% | 13.1% | 3,080 | 17,350 | 3,090 | 23,520 |
| Keelesdale-Eglinton West | Toronto | 16.9% | 68.9% | 14.2% | 1,960 | 7,960 | 1,650 | 11,560 |
| Kennedy Park | Toronto | 17.0% | 67.9% | 15.2% | 2,890 | 11,570 | 2,590 | 17,050 |
| Kennedy Road South | Brampton | 11.9% | 70.4% | 17.8% | 350 | 2,070 | 520 | 2,940 |
| Kensington-Chinatown | Toronto | 16.1% | 77.1% | 6.8% | 3,030 | 14,540 | 1,280 | 18,850 |
| Kingsview Village-The Westway | Toronto | 16.8% | 65.4% | 17.8% | 3,710 | 14,410 | 3,920 | 22,050 |
| Kingsway South | Toronto | 23.9% | 60.0% | 16.0% | 2,140 | 5,360 | 1,430 | 8,930 |
| Kleinburg | Vaughan | 8.7% | 67.1% | 24.2% | 2,750 | 21,300 | 7,690 | 31,740 |
| L'Amoreaux West | Toronto | 24.7% | 62.6% | 12.7% | 5,330 | 13,490 | 2,730 | 21,540 |
| Lakeview | Mississauga | 19.8% | 65.4% | 14.8% | 4,420 | 14,610 | 3,310 | 22,340 |
| Lambton Baby Point | Toronto | 15.3% | 65.4% | 19.3% | 1,220 | 5,230 | 1,550 | 8,000 |
| Lansing-Westgate | Toronto | 15.6% | 69.8% | 14.5% | 2,510 | 11,210 | 2,330 | 16,050 |
| Lawrence Park North | Toronto | 15.1% | 64.7% | 20.1% | 2,230 | 9,530 | 2,960 | 14,720 |
| Lawrence Park South | Toronto | 17.8% | 65.9% | 16.3% | 2,670 | 9,900 | 2,450 | 15,020 |
| Leaside-Bennington | Toronto | 17.5% | 65.1% | 17.4% | 2,950 | 10,930 | 2,920 | 16,810 |
| Lisgar | Mississauga | 10.6% | 72.8% | 16.6% | 3,170 | 21,740 | 4,940 | 29,860 |
| Little Portugal | Toronto | 12.0% | 78.4% | 9.6% | 1,900 | 12,380 | 1,510 | 15,790 |
| Long Branch | Toronto | 14.7% | 71.4% | 14.0% | 1,670 | 8,140 | 1,600 | 11,410 |
| Malton | Mississauga | 14.7% | 69.7% | 15.5% | 5,630 | 26,660 | 5,940 | 38,230 |
| Malvern East | Toronto | 17.3% | 67.6% | 15.0% | 4,530 | 17,680 | 3,930 | 26,140 |
| Malvern West | Toronto | 14.8% | 68.9% | 16.4% | 2,550 | 11,920 | 2,830 | 17,300 |
| Maple | Vaughan | 16.7% | 70.2% | 13.1% | 5,520 | 23,200 | 4,350 | 33,060 |
| Maple Leaf | Toronto | 20.2% | 65.3% | 14.5% | 2,030 | 6,570 | 1,460 | 10,050 |
| Maple Teston | Vaughan | 10.5% | 73.1% | 16.4% | 1,870 | 13,090 | 2,940 | 17,900 |
| Markham 16th | Markham | 13.5% | 67.5% | 19.1% | 8,890 | 44,530 | 12,580 | 66,000 |
| Markham Cathedral | Markham | 15.3% | 66.5% | 18.2% | 4,390 | 19,020 | 5,190 | 28,600 |
| Markham Central East | Markham | 17.4% | 67.4% | 15.2% | 2,200 | 8,540 | 1,920 | 12,660 |
| Markham East | Markham | 15.4% | 68.3% | 16.4% | 5,290 | 23,480 | 5,630 | 34,400 |
| Markham Hagerman | Markham | 19.1% | 68.2% | 12.7% | 3,770 | 13,470 | 2,500 | 19,750 |
| Markham Village | Markham | 23.2% | 61.8% | 15.0% | 5,760 | 15,360 | 3,740 | 24,860 |
| Markham West | Markham | 24.3% | 62.8% | 12.9% | 5,850 | 15,100 | 3,100 | 24,050 |
| Markland Wood | Toronto | 27.9% | 59.7% | 12.5% | 2,920 | 6,240 | 1,300 | 10,460 |
| Mavis-Erindale Employment Area | Mississauga | no data | no data | no data | - | - | - | - |
| Meadowvale | Mississauga | 15.7% | 68.0% | 16.3% | 6,140 | 26,610 | 6,380 | 39,120 |
| Meadowvale Business Park | Mississauga | no data | no data | no data | - | - | - | - |
| Meadowvale Village | Mississauga | 9.8% | 73.3% | 16.9% | 3,060 | 22,940 | 5,270 | 31,270 |
| Milliken | Toronto | 24.4% | 62.4% | 13.2% | 6,070 | 15,550 | 3,290 | 24,910 |
| Milliken East | Markham | 22.8% | 63.8% | 13.3% | 4,570 | 12,770 | 2,670 | 20,010 |
| Milliken West | Markham | 22.6% | 65.0% | 12.4% | 3,410 | 9,800 | 1,880 | 15,090 |
| Mimico-Queensway | Toronto | 15.5% | 71.3% | 13.2% | 2,830 | 13,040 | 2,410 | 18,280 |
| Mineola | Mississauga | 18.2% | 64.4% | 17.4% | 1,800 | 6,340 | 1,720 | 9,860 |
| Mississauga Valleys | Mississauga | 20.7% | 63.8% | 15.5% | 3,470 | 10,700 | 2,590 | 16,760 |
| Morningside | Toronto | 16.4% | 67.1% | 16.5% | 2,900 | 11,890 | 2,920 | 17,720 |
| Morningside Heights | Toronto | 14.6% | 69.1% | 16.3% | 3,650 | 17,310 | 4,090 | 25,050 |
| Moss Park | Toronto | 10.6% | 82.0% | 7.4% | 2,430 | 18,730 | 1,690 | 22,850 |
| Mount Dennis | Toronto | 14.9% | 69.0% | 16.1% | 1,970 | 9,130 | 2,130 | 13,230 |
| Mount Olive-Silverstone-Jamestown | Toronto | 13.3% | 68.6% | 18.1% | 4,190 | 21,660 | 5,710 | 31,560 |
| Mount Pleasant | Brampton | 6.0% | 67.8% | 26.2% | 2,260 | 25,450 | 9,840 | 37,550 |
| Mount Pleasant East | Toronto | 17.0% | 66.1% | 16.8% | 2,810 | 10,920 | 2,780 | 16,510 |
| New Toronto | Toronto | 16.9% | 68.8% | 14.3% | 1,950 | 7,920 | 1,650 | 11,520 |
| Newtonbrook East | Toronto | 23.1% | 67.0% | 9.8% | 3,700 | 10,720 | 1,570 | 15,990 |
| Newtonbrook West | Toronto | 18.6% | 70.6% | 10.8% | 4,450 | 16,920 | 2,600 | 23,970 |
| Ninth Line | Mississauga | 10.3% | 72.4% | 17.3% | 250 | 1,730 | 410 | 2,400 |
| North Riverdale | Toronto | 17.5% | 66.9% | 15.6% | 2,010 | 7,680 | 1,790 | 11,490 |
| North St.James Town | Toronto | 10.8% | 77.7% | 11.5% | 2,010 | 14,520 | 2,160 | 18,690 |
| North Toronto | Toronto | 11.3% | 80.4% | 8.3% | 1,810 | 12,840 | 1,320 | 15,970 |
| Northeast Employment Area | Mississauga | no data | no data | no data | - | - | - | - |
| Northwest Sandalwood Parkway | Brampton | 8.8% | 70.5% | 20.8% | 980 | 7,880 | 2,320 | 11,180 |
| O'Connor-Parkview | Toronto | 17.7% | 66.7% | 15.6% | 3,270 | 12,290 | 2,870 | 18,430 |
| Oakdale-Beverley Heights | Toronto | 14.8% | 67.9% | 17.3% | 3,170 | 14,510 | 3,690 | 21,370 |
| Oakridge | Toronto | 13.5% | 68.0% | 18.5% | 1,880 | 9,450 | 2,570 | 13,900 |
| Oakwood Village | Toronto | 18.0% | 67.2% | 14.8% | 3,740 | 13,980 | 3,070 | 20,790 |
| Old East York | Toronto | 18.3% | 66.3% | 15.5% | 1,690 | 6,120 | 1,430 | 9,240 |
| Palmerston-Little Italy | Toronto | 15.7% | 75.1% | 9.2% | 2,070 | 9,880 | 1,200 | 13,160 |
| Parkway Belt | Brampton | no data | no data | no data | - | - | - | - |
| Parkwoods-O'Connor Hills | Toronto | 17.4% | 66.0% | 16.7% | 2,440 | 9,260 | 2,340 | 14,040 |
| Pelmo Park-Humberlea | Toronto | 15.6% | 69.6% | 14.9% | 1,770 | 7,930 | 1,690 | 11,400 |
| Playter Estates-Danforth | Toronto | 19.3% | 66.4% | 14.2% | 1,450 | 5,000 | 1,070 | 7,520 |
| Pleasant View | Toronto | 22.0% | 66.1% | 11.9% | 3,310 | 9,970 | 1,790 | 15,070 |
| Port Credit | Mississauga | 22.9% | 66.1% | 11.0% | 2,510 | 7,230 | 1,200 | 10,940 |
| Princess-Rosethorn | Toronto | 20.7% | 63.7% | 15.6% | 2,310 | 7,130 | 1,750 | 11,190 |
| Queen Street Corridor | Brampton | 15.4% | 65.9% | 18.7% | 3,460 | 14,800 | 4,200 | 22,470 |
| Rathwood | Mississauga | 24.1% | 62.7% | 13.1% | 6,680 | 17,370 | 3,640 | 27,700 |
| Regent Park | Toronto | 9.8% | 76.6% | 13.6% | 1,250 | 9,790 | 1,740 | 12,780 |
| Rexdale-Kipling | Toronto | 17.8% | 67.0% | 15.2% | 1,850 | 6,970 | 1,580 | 10,410 |
| Richmond Hill B | Richmond Hill | 15.7% | 71.5% | 12.8% | 2,700 | 12,290 | 2,210 | 17,190 |
| Richmond Hill Bathurst | Richmond Hill | 12.0% | 70.3% | 17.7% | 2,400 | 14,020 | 3,530 | 19,940 |
| Richmond Hill C | Richmond Hill | 23.8% | 63.8% | 12.4% | 3,890 | 10,400 | 2,020 | 16,320 |
| Richmond Hill Doncrest | Richmond Hill | 23.3% | 64.6% | 12.1% | 5,250 | 14,580 | 2,730 | 22,550 |
| Richmond Hill East | Richmond Hill | 15.6% | 69.0% | 15.3% | 3,540 | 15,640 | 3,470 | 22,660 |
| Richmond Hill North East | Richmond Hill | 21.1% | 66.1% | 12.7% | 3,640 | 11,400 | 2,200 | 17,240 |
| Richmond Hill North West | Richmond Hill | 15.2% | 70.6% | 14.2% | 4,070 | 18,940 | 3,800 | 26,810 |
| Richmond Hill Richvale | Richmond Hill | 23.9% | 64.2% | 11.9% | 5,400 | 14,540 | 2,700 | 22,640 |
| Rockcliffe-Smythe | Toronto | 18.4% | 66.6% | 15.0% | 4,080 | 14,730 | 3,310 | 22,120 |
| Roncesvalles | Toronto | 13.0% | 72.4% | 14.6% | 1,910 | 10,600 | 2,140 | 14,650 |
| Rosedale-Moore Park | Toronto | 27.8% | 60.4% | 11.8% | 5,630 | 12,220 | 2,400 | 20,250 |
| Runnymede-Bloor West Village | Toronto | 13.9% | 66.3% | 19.8% | 1,410 | 6,730 | 2,010 | 10,140 |
| Rustic | Toronto | 19.3% | 63.6% | 17.1% | 1,840 | 6,070 | 1,630 | 9,540 |
| Scarborough Village | Toronto | 15.0% | 66.5% | 18.5% | 2,510 | 11,130 | 3,100 | 16,740 |
| Sheridan | Mississauga | 19.8% | 64.1% | 16.0% | 3,130 | 10,120 | 2,530 | 15,780 |
| Sheridan Park | Mississauga | no data | no data | no data | - | - | - | - |
| Snelgrove-Heart Lake | Brampton | 14.7% | 68.9% | 16.3% | 5,770 | 27,050 | 6,410 | 39,240 |
| South Eglinton-Davisville | Toronto | 15.6% | 75.0% | 9.4% | 3,640 | 17,430 | 2,190 | 23,260 |
| South Parkdale | Toronto | 14.1% | 77.0% | 8.9% | 3,030 | 16,600 | 1,930 | 21,560 |
| South Riverdale | Toronto | 12.9% | 73.1% | 14.0% | 3,650 | 20,750 | 3,980 | 28,390 |
| South of Maple | Vaughan | 15.7% | 72.8% | 11.5% | 2,280 | 10,610 | 1,680 | 14,580 |
| Southdown Employment Area | Mississauga | no data | no data | no data | - | - | - | - |
| Springdale | Brampton | 12.3% | 69.9% | 17.8% | 11,550 | 65,540 | 16,650 | 93,740 |
| St Lawrence-East Bayfront-The Islands | Toronto | 12.7% | 79.9% | 7.4% | 3,990 | 25,110 | 2,310 | 31,410 |
| St.Andrew-Windfields | Toronto | 21.1% | 64.6% | 14.3% | 3,610 | 11,020 | 2,440 | 17,060 |
| Steeles | Toronto | 27.8% | 60.2% | 12.0% | 6,400 | 13,850 | 2,770 | 23,020 |
| Stonegate-Queensway | Toronto | 18.3% | 65.3% | 16.4% | 4,700 | 16,760 | 4,210 | 25,660 |
| Streetsville | Mississauga | 19.6% | 65.3% | 15.1% | 2,360 | 7,890 | 1,830 | 12,070 |
| Tam O'Shanter-Sullivan | Toronto | 23.5% | 63.2% | 13.3% | 6,470 | 17,410 | 3,670 | 27,550 |
| Taylor-Massey | Toronto | 11.7% | 70.5% | 17.8% | 1,790 | 10,840 | 2,740 | 15,370 |
| The Beaches | Toronto | 17.3% | 65.7% | 17.0% | 3,730 | 14,170 | 3,660 | 21,570 |
| The Hill | Richmond Hill | 10.2% | 69.7% | 20.0% | 3,760 | 25,580 | 7,340 | 36,680 |
| Thistletown-Beaumond Heights | Toronto | 18.5% | 66.6% | 14.9% | 1,820 | 6,550 | 1,470 | 9,840 |
| Thorncliffe Park | Toronto | 12.2% | 63.7% | 24.1% | 2,520 | 13,150 | 4,970 | 20,640 |
| Thornhill North | Markham | 29.6% | 58.0% | 12.4% | 4,330 | 8,460 | 1,810 | 14,600 |
| Thornhill South | Markham | 17.9% | 69.9% | 12.2% | 2,100 | 8,220 | 1,430 | 11,740 |
| Toronto Gore Rural Estate | Brampton | 23.1% | 63.8% | 13.1% | 500 | 1,380 | 280 | 2,170 |
| Trinity-Bellwoods | Toronto | 15.8% | 74.0% | 10.2% | 2,480 | 11,610 | 1,600 | 15,690 |
| Unionville | Markham | 23.3% | 63.0% | 13.7% | 4,080 | 11,060 | 2,400 | 17,540 |
| University | Toronto | 19.2% | 73.8% | 7.0% | 1,460 | 5,620 | 530 | 7,610 |
| University of Toronto Mississauga | Mississauga | no data | no data | no data | - | - | - | - |
| Vales of Castlemore | Brampton | 12.9% | 71.4% | 15.6% | 2,130 | 11,760 | 2,570 | 16,460 |
| Vales of Castlemore North | Brampton | 12.6% | 69.2% | 18.2% | 820 | 4,500 | 1,180 | 6,500 |
| Vales of Humber | Brampton | 11.6% | 68.3% | 20.1% | 960 | 5,660 | 1,670 | 8,290 |
| Victoria Village | Toronto | 20.6% | 64.1% | 15.4% | 3,630 | 11,310 | 2,710 | 17,650 |
| Wellington Place | Toronto | 3.3% | 92.3% | 4.5% | 850 | 23,710 | 1,140 | 25,700 |
| West Hill | Toronto | 16.3% | 67.8% | 16.0% | 4,620 | 19,240 | 4,530 | 28,380 |
| West Humber-Clairville | Toronto | 16.7% | 70.5% | 12.8% | 5,630 | 23,800 | 4,310 | 33,740 |
| West Queen West | Toronto | 8.6% | 83.1% | 8.2% | 1,190 | 11,470 | 1,140 | 13,800 |
| West Rouge | Toronto | 21.8% | 63.9% | 14.4% | 4,560 | 13,380 | 3,010 | 20,950 |
| Western Business Park | Mississauga | no data | no data | no data | - | - | - | - |
| Westminster-Branson | Toronto | 20.8% | 66.3% | 12.9% | 5,410 | 17,280 | 3,360 | 26,050 |
| Weston | Toronto | 15.1% | 68.3% | 16.5% | 2,860 | 12,890 | 3,120 | 18,870 |
| Weston-Pelham Park | Toronto | 13.9% | 71.4% | 14.7% | 1,470 | 7,550 | 1,550 | 10,580 |
| Wexford/Maryvale | Toronto | 17.4% | 68.0% | 14.6% | 4,990 | 19,500 | 4,190 | 28,680 |
| Willowdale West | Toronto | 21.2% | 68.4% | 10.5% | 3,630 | 11,700 | 1,790 | 17,110 |
| Willowridge-Martingrove-Richview | Toronto | 22.6% | 61.8% | 15.6% | 5,080 | 13,870 | 3,500 | 22,460 |
| Woburn North | Toronto | 15.3% | 69.3% | 15.5% | 4,090 | 18,540 | 4,130 | 26,760 |
| Woodbine Corridor | Toronto | 12.5% | 68.7% | 18.8% | 1,530 | 8,440 | 2,310 | 12,280 |
| Woodbine-Lumsden | Toronto | 16.2% | 67.4% | 16.4% | 1,300 | 5,410 | 1,310 | 8,030 |
| Woodbridge Centre | Vaughan | 22.1% | 65.9% | 12.0% | 1,980 | 5,890 | 1,080 | 8,940 |
| Woodbridge East | Vaughan | 24.9% | 63.0% | 12.1% | 4,140 | 10,480 | 2,020 | 16,640 |
| Woodbridge North | Vaughan | 12.8% | 70.4% | 16.8% | 6,500 | 35,920 | 8,580 | 51,000 |
| Woodbridge South East | Vaughan | 26.0% | 61.5% | 12.6% | 1,890 | 4,480 | 920 | 7,280 |
| Woodbridge South West | Vaughan | 26.3% | 61.8% | 11.9% | 4,860 | 11,440 | 2,200 | 18,500 |
| Woodbridge West | Vaughan | 14.3% | 69.7% | 16.0% | 640 | 3,100 | 710 | 4,440 |
| Wychwood | Toronto | 24.3% | 62.9% | 12.9% | 3,350 | 8,690 | 1,780 | 13,810 |
| Yonge-Bay Corridor | Toronto | 7.1% | 85.3% | 7.6% | 900 | 10,800 | 960 | 12,670 |
| Yonge-Doris | Toronto | 16.8% | 72.5% | 10.7% | 3,410 | 14,690 | 2,170 | 20,270 |
| Yonge-Eglinton | Toronto | 15.6% | 70.6% | 13.8% | 1,970 | 8,890 | 1,740 | 12,600 |
| Yonge-St.Clair | Toronto | 25.8% | 63.9% | 10.3% | 3,360 | 8,300 | 1,340 | 13,000 |
| York University Heights | Toronto | 13.7% | 72.8% | 13.6% | 3,930 | 20,920 | 3,900 | 28,740 |
| Yorkdale-Glen Park | Toronto | 19.5% | 68.4% | 12.1% | 3,320 | 11,680 | 2,060 | 17,060 |
What the map shows
This map shows how old the neighbourhoods of Toronto, Mississauga, Brampton, Vaughan, Richmond Hill and Markham are: the share of residents who are seniors, adults and children, based on the 2021 census.
Key findings:
Seniors are 65 and over, adults 15 to 64 and children 0 to 14, the census's own age groups. Rankings are of areas with 1,000 residents or more.
Sources and licence
Back to the map