Every neighbourhood in Winnipeg, by seniors (65+)
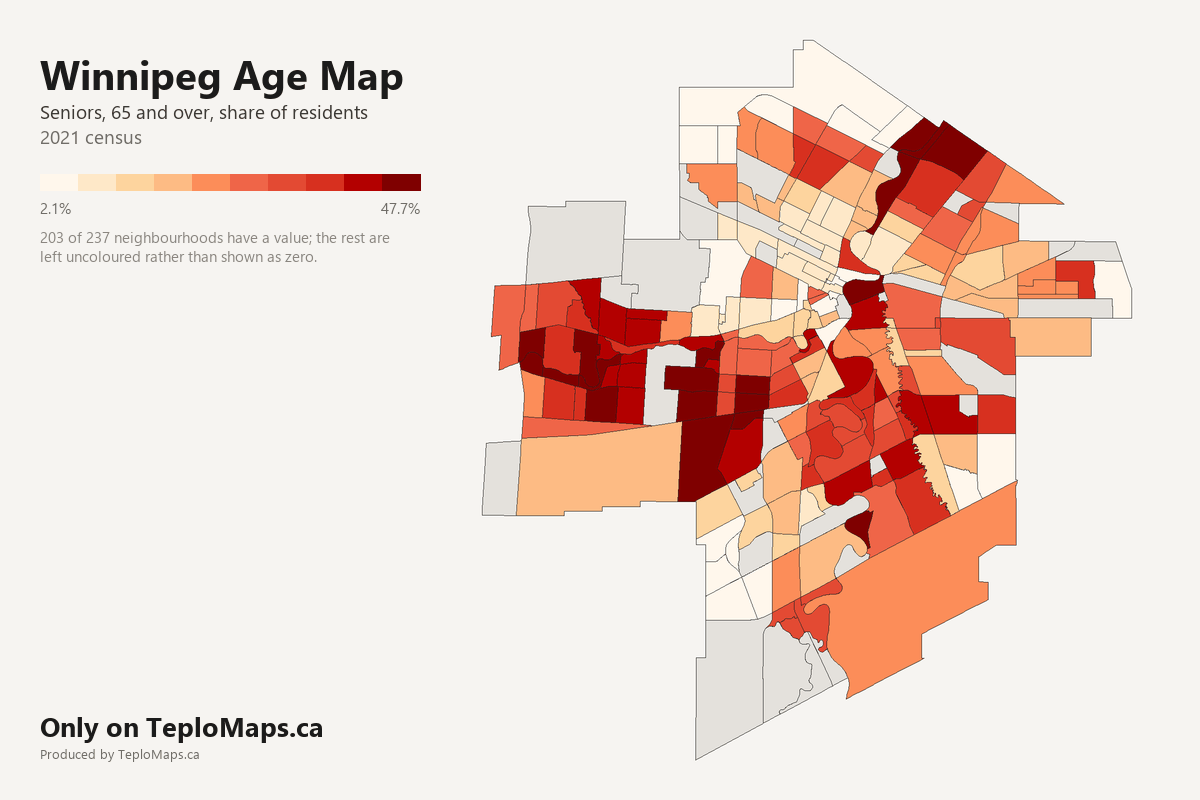
Show the figures for all 237 neighbourhoods
| Neighbourhood | Seniors (65+) | Adults (15 to 64) | Children (0 to 14) | Seniors (65+), estimated | Adults (15 to 64), estimated | Children (0 to 14), estimated | Residents, estimated |
|---|---|---|---|---|---|---|---|
| Agassiz | 11.8% | 75.4% | 12.8% | 70 | 430 | 70 | 570 |
| Airport | no data | no data | no data | - | - | - | - |
| Alpine Place | 19.5% | 63.9% | 16.6% | 940 | 3,070 | 800 | 4,810 |
| Amber Trails | 8.9% | 69.1% | 22.0% | 780 | 6,020 | 1,920 | 8,720 |
| Archwood | 12.8% | 73.6% | 13.5% | 90 | 540 | 100 | 730 |
| Armstrong Point | 12.8% | 76.6% | 10.6% | 30 | 170 | 20 | 220 |
| Assiniboia Downs | 18.0% | 65.7% | 16.3% | 190 | 680 | 170 | 1,030 |
| Assiniboine Park | no data | no data | no data | - | - | - | - |
| Beaumont | 16.2% | 68.7% | 15.1% | 380 | 1,590 | 350 | 2,320 |
| Betsworth | 21.0% | 62.5% | 16.5% | 820 | 2,430 | 640 | 3,880 |
| Birchwood | 20.3% | 66.2% | 13.5% | 520 | 1,700 | 350 | 2,570 |
| Booth | 25.3% | 60.8% | 13.8% | 1,500 | 3,610 | 820 | 5,940 |
| Bridgwater Centre | 3.3% | 71.3% | 25.4% | 80 | 1,700 | 600 | 2,380 |
| Bridgwater Forest | 12.6% | 68.3% | 19.1% | 600 | 3,220 | 900 | 4,720 |
| Bridgwater Lakes | 3.3% | 71.3% | 25.4% | 80 | 1,830 | 650 | 2,570 |
| Bridgwater Trails | 3.3% | 71.3% | 25.4% | 130 | 2,820 | 1,000 | 3,950 |
| Broadway-Assiniboine | 14.2% | 78.6% | 7.1% | 860 | 4,740 | 430 | 6,030 |
| Brockville | 28.1% | 58.7% | 13.2% | 710 | 1,480 | 330 | 2,530 |
| Brooklands | 11.3% | 69.8% | 19.0% | 350 | 2,170 | 590 | 3,110 |
| Bruce Park | 24.4% | 64.2% | 11.4% | 530 | 1,400 | 250 | 2,180 |
| Buchanan | 18.0% | 65.7% | 16.3% | 440 | 1,590 | 390 | 2,420 |
| Buffalo | no data | no data | no data | - | - | - | - |
| Burrows Central | 11.6% | 70.1% | 18.3% | 650 | 3,950 | 1,030 | 5,630 |
| Burrows-Keewatin | 14.2% | 62.4% | 23.4% | 400 | 1,740 | 650 | 2,790 |
| Canterbury Park | 8.9% | 69.6% | 21.6% | 740 | 5,820 | 1,810 | 8,370 |
| Centennial | 10.6% | 65.0% | 24.4% | 350 | 2,150 | 810 | 3,310 |
| Central Park | 17.8% | 68.4% | 13.8% | 630 | 2,420 | 490 | 3,540 |
| Central River Heights | 26.4% | 58.7% | 14.9% | 780 | 1,740 | 440 | 2,970 |
| Central St. Boniface | 24.5% | 62.9% | 12.6% | 1,800 | 4,630 | 930 | 7,350 |
| Chalmers | 11.4% | 69.6% | 19.1% | 1,110 | 6,790 | 1,860 | 9,760 |
| Chevrier | 15.1% | 68.1% | 16.8% | 310 | 1,390 | 340 | 2,040 |
| China Town | 10.5% | 64.6% | 24.9% | 60 | 380 | 150 | 590 |
| Civic Centre | 10.3% | 80.1% | 9.6% | 50 | 400 | 50 | 490 |
| Cloutier Drive | 19.3% | 64.7% | 16.0% | 70 | 240 | 60 | 380 |
| Colony | 12.1% | 76.0% | 11.9% | 120 | 770 | 120 | 1,010 |
| Crescent Park | 20.6% | 68.0% | 11.4% | 470 | 1,550 | 260 | 2,280 |
| Crescentwood | 18.2% | 69.2% | 12.6% | 450 | 1,720 | 310 | 2,480 |
| Crestview | 19.2% | 64.4% | 16.4% | 1,660 | 5,550 | 1,420 | 8,630 |
| Dakota Crossing | 21.5% | 63.6% | 14.8% | 2,780 | 8,210 | 1,910 | 12,910 |
| Daniel McIntyre | 14.6% | 68.3% | 17.2% | 1,400 | 6,540 | 1,640 | 9,580 |
| Deer Lodge | 16.6% | 67.4% | 16.0% | 610 | 2,470 | 590 | 3,670 |
| Dufferin | 11.5% | 66.4% | 22.2% | 260 | 1,480 | 490 | 2,230 |
| Dufferin Industrial | no data | no data | no data | - | - | - | - |
| Dufresne | 12.8% | 73.6% | 13.5% | 50 | 290 | 50 | 400 |
| Dugald | no data | no data | no data | - | - | - | - |
| Eaglemere | 16.7% | 65.1% | 18.2% | 480 | 1,870 | 520 | 2,870 |
| Earl Grey | 13.8% | 72.9% | 13.3% | 620 | 3,270 | 600 | 4,480 |
| East Elmwood | 12.3% | 68.3% | 19.4% | 450 | 2,470 | 700 | 3,610 |
| Ebby-Wentworth | 13.8% | 72.9% | 13.3% | 90 | 490 | 90 | 670 |
| Edgeland | 25.3% | 59.3% | 15.4% | 370 | 870 | 220 | 1,460 |
| Elm Park | 22.6% | 63.6% | 13.8% | 360 | 1,000 | 220 | 1,580 |
| Elmhurst | 25.2% | 60.4% | 14.5% | 1,080 | 2,580 | 620 | 4,280 |
| Eric Coy | 30.5% | 54.9% | 14.6% | 690 | 1,240 | 330 | 2,250 |
| Exchange District | 10.4% | 74.3% | 15.3% | 100 | 740 | 150 | 990 |
| Fairfield Park | 12.3% | 74.1% | 13.6% | 640 | 3,850 | 700 | 5,190 |
| Fort Richmond | 14.2% | 68.9% | 16.8% | 1,400 | 6,800 | 1,660 | 9,860 |
| Fraipont | 8.9% | 68.6% | 22.5% | 300 | 2,280 | 750 | 3,320 |
| Garden City | 22.0% | 62.8% | 15.2% | 1,380 | 3,950 | 960 | 6,280 |
| Glendale | 26.3% | 60.7% | 13.0% | 230 | 530 | 110 | 870 |
| Glenelm | 11.1% | 70.1% | 18.8% | 240 | 1,550 | 420 | 2,210 |
| Glenwood | 15.3% | 69.9% | 14.8% | 610 | 2,780 | 590 | 3,990 |
| Grant Park | 22.1% | 65.9% | 12.0% | 700 | 2,080 | 380 | 3,160 |
| Grassie | 15.9% | 65.3% | 18.9% | 660 | 2,730 | 790 | 4,180 |
| Griffin | no data | no data | no data | - | - | - | - |
| Heritage Park | 24.6% | 61.2% | 14.3% | 1,430 | 3,560 | 830 | 5,820 |
| Holden | 19.2% | 62.1% | 18.7% | 40 | 120 | 40 | 200 |
| Inkster Gardens | 8.0% | 69.5% | 22.4% | 500 | 4,350 | 1,400 | 6,250 |
| Inkster Industrial Park | no data | no data | no data | - | - | - | - |
| Inkster-Faraday | 11.6% | 68.3% | 20.1% | 520 | 3,060 | 900 | 4,480 |
| Island Lakes | 14.1% | 68.5% | 17.4% | 950 | 4,610 | 1,170 | 6,730 |
| J. B. Mitchell | 19.3% | 67.3% | 13.5% | 410 | 1,430 | 290 | 2,130 |
| Jameswood | 23.3% | 62.0% | 14.7% | 300 | 800 | 190 | 1,300 |
| Jefferson | 14.9% | 68.0% | 17.2% | 1,400 | 6,420 | 1,620 | 9,440 |
| Kensington | 10.7% | 73.3% | 16.0% | 30 | 210 | 50 | 280 |
| Kern Park | 16.0% | 66.5% | 17.5% | 310 | 1,280 | 340 | 1,930 |
| Kil-Cona Park | 16.7% | 65.1% | 18.2% | 50 | 200 | 60 | 310 |
| Kildare-Redonda | 22.0% | 61.8% | 16.2% | 1,370 | 3,850 | 1,010 | 6,230 |
| Kildonan Crossing | 16.7% | 65.1% | 18.2% | 180 | 700 | 200 | 1,070 |
| Kildonan Drive | 28.8% | 58.7% | 12.5% | 1,520 | 3,090 | 660 | 5,270 |
| Kildonan Park | no data | no data | no data | - | - | - | - |
| King Edward | 10.8% | 73.1% | 16.1% | 650 | 4,390 | 970 | 6,010 |
| Kingston Crescent | 22.9% | 63.3% | 13.8% | 180 | 510 | 110 | 800 |
| Kirkfield | 33.9% | 54.1% | 11.9% | 990 | 1,580 | 350 | 2,920 |
| La Barriere | no data | no data | no data | - | - | - | - |
| Lavalee | 19.9% | 63.2% | 16.9% | 240 | 780 | 210 | 1,230 |
| Legislature | 12.8% | 76.6% | 10.6% | 20 | 110 | 10 | 140 |
| Leila North | 17.2% | 65.7% | 17.1% | 700 | 2,670 | 700 | 4,070 |
| Leila-McPhillips Triangle | 21.2% | 63.1% | 15.6% | 670 | 2,000 | 500 | 3,170 |
| Linden Ridge | 12.6% | 68.3% | 19.1% | 270 | 1,490 | 420 | 2,180 |
| Linden Woods | 23.8% | 62.9% | 13.4% | 2,110 | 5,570 | 1,180 | 8,860 |
| Logan-C.P.R. | 10.6% | 64.5% | 24.9% | 30 | 210 | 80 | 330 |
| Lord Roberts | 12.4% | 73.3% | 14.3% | 660 | 3,910 | 760 | 5,330 |
| Lord Selkirk Park | 10.9% | 60.5% | 28.6% | 140 | 780 | 370 | 1,290 |
| Luxton | 14.5% | 67.3% | 18.2% | 360 | 1,670 | 450 | 2,480 |
| Maginot | 13.4% | 66.7% | 19.9% | 210 | 1,050 | 310 | 1,580 |
| Mandalay West | 16.8% | 66.3% | 16.9% | 1,040 | 4,100 | 1,050 | 6,190 |
| Maple Grove Park | no data | no data | no data | - | - | - | - |
| Margaret Park | 19.8% | 64.1% | 16.1% | 440 | 1,420 | 360 | 2,220 |
| Marlton | 24.9% | 61.4% | 13.8% | 280 | 690 | 160 | 1,130 |
| Mathers | 19.3% | 67.3% | 13.5% | 530 | 1,850 | 370 | 2,750 |
| Maybank | 18.0% | 68.4% | 13.6% | 400 | 1,500 | 300 | 2,200 |
| McLeod Industrial | no data | no data | no data | - | - | - | - |
| McMillan | 22.9% | 69.5% | 7.7% | 880 | 2,660 | 290 | 3,830 |
| Meadowood | 25.3% | 59.0% | 15.7% | 1,580 | 3,700 | 990 | 6,270 |
| Meadows | 15.0% | 67.0% | 18.0% | 900 | 4,050 | 1,090 | 6,040 |
| Melrose | 15.8% | 67.9% | 16.4% | 330 | 1,400 | 340 | 2,070 |
| Minnetonka | 24.9% | 59.9% | 15.2% | 1,110 | 2,670 | 680 | 4,460 |
| Minto | 11.6% | 72.1% | 16.3% | 680 | 4,200 | 950 | 5,820 |
| Mission Gardens | 14.6% | 65.6% | 19.9% | 490 | 2,220 | 670 | 3,390 |
| Mission Industrial | 17.9% | 63.6% | 18.5% | 20 | 70 | 20 | 100 |
| Montcalm | 11.6% | 74.6% | 13.8% | 650 | 4,160 | 770 | 5,580 |
| Munroe East | 16.0% | 64.2% | 19.8% | 1,440 | 5,810 | 1,790 | 9,050 |
| Munroe West | 13.4% | 70.2% | 16.4% | 410 | 2,140 | 500 | 3,050 |
| Murray Industrial Park | no data | no data | no data | - | - | - | - |
| Mynarski | 13.9% | 68.8% | 17.2% | 310 | 1,520 | 380 | 2,210 |
| Niakwa Park | 19.5% | 65.0% | 15.5% | 180 | 600 | 140 | 920 |
| Niakwa Place | 25.4% | 58.8% | 15.8% | 720 | 1,670 | 450 | 2,840 |
| Norberry | 21.0% | 64.2% | 14.8% | 290 | 890 | 210 | 1,390 |
| Normand Park | 30.0% | 55.5% | 14.5% | 660 | 1,220 | 320 | 2,200 |
| North Inkster Industrial | 8.0% | 69.5% | 22.4% | 160 | 1,390 | 450 | 2,010 |
| North Point Douglas | 21.4% | 60.6% | 18.0% | 570 | 1,620 | 480 | 2,660 |
| North River Heights | 17.8% | 66.3% | 15.9% | 950 | 3,570 | 850 | 5,380 |
| North St. Boniface | 27.7% | 59.4% | 12.8% | 550 | 1,190 | 260 | 1,990 |
| North Transcona Yards | no data | no data | no data | - | - | - | - |
| Norwood East | 16.6% | 70.2% | 13.3% | 710 | 3,020 | 570 | 4,300 |
| Norwood West | 16.7% | 67.8% | 15.5% | 480 | 1,970 | 450 | 2,900 |
| Oak Point Highway | no data | no data | no data | - | - | - | - |
| Old Tuxedo | 27.8% | 57.7% | 14.5% | 240 | 500 | 120 | 860 |
| Omand's Creek Industrial | no data | no data | no data | - | - | - | - |
| Pacific Industrial | no data | no data | no data | - | - | - | - |
| Parc La Salle | 19.3% | 64.7% | 16.0% | 390 | 1,320 | 320 | 2,030 |
| Parker | no data | no data | no data | - | - | - | - |
| Peguis | 13.4% | 65.7% | 21.0% | 960 | 4,720 | 1,500 | 7,180 |
| Pembina Strip | 21.0% | 68.7% | 10.3% | 920 | 3,010 | 450 | 4,390 |
| Perrault | no data | no data | no data | - | - | - | - |
| Point Road | 19.4% | 66.1% | 14.5% | 380 | 1,300 | 290 | 1,970 |
| Polo Park | 10.7% | 73.3% | 16.0% | 50 | 360 | 80 | 490 |
| Portage & Main | 7.1% | 85.4% | 7.5% | 30 | 350 | 30 | 410 |
| Portage-Ellice | 17.8% | 68.4% | 13.8% | 290 | 1,100 | 220 | 1,610 |
| Prairie Pointe | 3.3% | 71.3% | 25.4% | 80 | 1,750 | 620 | 2,460 |
| Pulberry | 19.0% | 65.2% | 15.9% | 880 | 3,030 | 740 | 4,650 |
| Radisson | 15.6% | 68.5% | 16.0% | 490 | 2,140 | 500 | 3,120 |
| Regent | 14.1% | 65.6% | 20.3% | 270 | 1,260 | 390 | 1,920 |
| Richmond Lakes | 19.3% | 64.7% | 16.0% | 300 | 1,020 | 250 | 1,570 |
| Richmond West | 15.9% | 69.7% | 14.4% | 1,410 | 6,190 | 1,280 | 8,880 |
| Ridgedale | 27.6% | 58.3% | 14.1% | 160 | 340 | 80 | 580 |
| Ridgewood South | 16.9% | 64.3% | 18.7% | 240 | 910 | 270 | 1,420 |
| River East | 25.7% | 59.0% | 15.3% | 2,030 | 4,670 | 1,210 | 7,910 |
| River Park South | 18.0% | 64.1% | 17.9% | 2,440 | 8,700 | 2,440 | 13,580 |
| River West Park | 26.0% | 58.0% | 16.0% | 380 | 850 | 230 | 1,460 |
| River-Osborne | 9.9% | 82.1% | 8.0% | 500 | 4,180 | 400 | 5,090 |
| Riverbend | 9.8% | 71.5% | 18.7% | 540 | 3,900 | 1,020 | 5,450 |
| Rivergrove | 30.2% | 57.0% | 12.8% | 820 | 1,560 | 350 | 2,740 |
| Riverview | 23.0% | 63.9% | 13.1% | 1,030 | 2,870 | 590 | 4,490 |
| Robertson | 12.6% | 70.4% | 17.1% | 640 | 3,610 | 880 | 5,130 |
| Roblin Park | 22.7% | 61.8% | 15.5% | 210 | 580 | 150 | 950 |
| Rockwood | 19.4% | 68.8% | 11.7% | 810 | 2,870 | 490 | 4,170 |
| Roslyn | 25.2% | 69.6% | 5.2% | 1,190 | 3,280 | 240 | 4,710 |
| Rosser-Old Kildonan | 9.7% | 69.1% | 21.3% | 130 | 920 | 280 | 1,330 |
| Rossmere-A | 21.0% | 62.9% | 16.1% | 2,950 | 8,830 | 2,260 | 14,030 |
| Rossmere-B | 17.9% | 67.0% | 15.1% | 710 | 2,640 | 600 | 3,940 |
| Royalwood | 12.0% | 68.5% | 19.5% | 530 | 3,000 | 850 | 4,380 |
| Sage Creek | 8.1% | 65.3% | 26.6% | 610 | 4,890 | 1,990 | 7,500 |
| Sargent Park | 17.1% | 68.1% | 14.7% | 1,070 | 4,250 | 920 | 6,240 |
| Saskatchewan North | no data | no data | no data | - | - | - | - |
| Seven Oaks | 14.3% | 68.6% | 17.1% | 450 | 2,180 | 540 | 3,170 |
| Shaughnessy Park | 14.0% | 68.4% | 17.6% | 420 | 2,080 | 540 | 3,040 |
| Silver Heights | 23.1% | 63.4% | 13.6% | 1,250 | 3,440 | 740 | 5,430 |
| Sir John Franklin | 18.0% | 64.0% | 17.9% | 510 | 1,810 | 510 | 2,820 |
| South Point Douglas | 10.3% | 80.1% | 9.6% | 20 | 190 | 20 | 240 |
| South Pointe | 5.5% | 71.4% | 23.1% | 420 | 5,430 | 1,760 | 7,610 |
| South Portage | 8.7% | 83.9% | 7.4% | 210 | 2,060 | 180 | 2,460 |
| South River Heights | 26.7% | 58.4% | 14.9% | 650 | 1,410 | 360 | 2,420 |
| South Tuxedo | 35.3% | 52.9% | 11.8% | 1,310 | 1,960 | 440 | 3,710 |
| Southboine | 30.3% | 54.6% | 15.0% | 490 | 890 | 240 | 1,630 |
| Southdale | 23.5% | 61.6% | 14.8% | 1,440 | 3,760 | 900 | 6,100 |
| Southland Park | 21.9% | 64.1% | 13.9% | 230 | 680 | 150 | 1,060 |
| Spence | 8.8% | 73.2% | 18.0% | 370 | 3,080 | 760 | 4,210 |
| Springfield North | 18.7% | 64.5% | 16.8% | 1,120 | 3,870 | 1,010 | 6,000 |
| Springfield South | 18.7% | 64.5% | 16.8% | 260 | 880 | 230 | 1,370 |
| St. Boniface Industrial Park | 19.2% | 62.1% | 18.7% | 300 | 970 | 290 | 1,560 |
| St. George | 17.9% | 64.6% | 17.4% | 460 | 1,650 | 450 | 2,550 |
| St. James Industrial | 2.1% | 85.4% | 12.5% | 0 | 90 | 10 | 100 |
| St. John's | 11.0% | 69.1% | 19.9% | 920 | 5,770 | 1,670 | 8,360 |
| St. John's Park | 14.5% | 67.3% | 18.2% | 90 | 430 | 110 | 630 |
| St. Matthews | 10.2% | 72.1% | 17.7% | 580 | 4,120 | 1,010 | 5,700 |
| St. Norbert | 19.3% | 64.7% | 16.0% | 430 | 1,440 | 360 | 2,230 |
| St. Vital Centre | no data | no data | no data | - | - | - | - |
| St. Vital Perimeter South | 15.2% | 68.5% | 16.3% | 280 | 1,250 | 300 | 1,820 |
| Stock Yards | 17.3% | 65.4% | 17.3% | 100 | 390 | 100 | 590 |
| Sturgeon Creek | 22.5% | 63.0% | 14.5% | 730 | 2,030 | 470 | 3,230 |
| Symington Yards | no data | no data | no data | - | - | - | - |
| Talbot-Grey | 12.3% | 66.8% | 20.9% | 320 | 1,750 | 550 | 2,620 |
| Templeton-Sinclair | 17.7% | 65.2% | 17.1% | 1,010 | 3,710 | 970 | 5,690 |
| The Forks | no data | no data | no data | - | - | - | - |
| The Maples | 15.7% | 66.0% | 18.3% | 2,270 | 9,560 | 2,640 | 14,470 |
| The Mint | no data | no data | no data | - | - | - | - |
| Tissot | no data | no data | no data | - | - | - | - |
| Transcona North | no data | no data | no data | - | - | - | - |
| Transcona South | 15.1% | 65.1% | 19.7% | 80 | 360 | 110 | 560 |
| Transcona Yards | no data | no data | no data | - | - | - | - |
| Trappistes | no data | no data | no data | - | - | - | - |
| Turnbull Drive | no data | no data | no data | - | - | - | - |
| Tuxedo | 32.7% | 55.2% | 12.1% | 590 | 1,000 | 220 | 1,810 |
| Tuxedo Industrial | 28.4% | 59.5% | 12.1% | 730 | 1,520 | 310 | 2,560 |
| Tyndall Park | 15.9% | 68.1% | 16.0% | 1,980 | 8,440 | 1,980 | 12,400 |
| Tyne-Tees | no data | no data | no data | - | - | - | - |
| University | no data | no data | no data | - | - | - | - |
| Valhalla | 47.7% | 45.5% | 6.8% | 1,460 | 1,390 | 210 | 3,060 |
| Valley Gardens | 18.0% | 62.6% | 19.3% | 1,490 | 5,190 | 1,600 | 8,280 |
| Varennes | 25.4% | 60.2% | 14.4% | 260 | 620 | 150 | 1,030 |
| Varsity View | 24.9% | 61.4% | 13.8% | 600 | 1,480 | 330 | 2,420 |
| Vialoux | 24.9% | 61.4% | 13.8% | 240 | 590 | 130 | 960 |
| Victoria Crescent | 19.1% | 65.1% | 15.8% | 100 | 330 | 80 | 500 |
| Victoria West | 15.8% | 68.5% | 15.8% | 440 | 1,900 | 440 | 2,770 |
| Vista | 22.7% | 60.8% | 16.4% | 310 | 830 | 230 | 1,370 |
| Waverley Heights | 14.7% | 69.2% | 16.1% | 550 | 2,590 | 600 | 3,750 |
| Waverley West B | no data | no data | no data | - | - | - | - |
| Wellington Crescent | 17.8% | 67.3% | 14.8% | 250 | 930 | 210 | 1,380 |
| West Alexander | 11.5% | 68.2% | 20.3% | 490 | 2,890 | 860 | 4,230 |
| West Broadway | 12.3% | 76.6% | 11.1% | 740 | 4,580 | 660 | 5,980 |
| West Fort Garry Industrial | no data | no data | no data | - | - | - | - |
| West Kildonan Industrial | 10.1% | 69.5% | 20.4% | 240 | 1,640 | 480 | 2,350 |
| West Perimeter South | no data | no data | no data | - | - | - | - |
| West Wolseley | 17.5% | 66.1% | 16.5% | 70 | 280 | 70 | 420 |
| Westdale | 16.6% | 64.5% | 18.9% | 800 | 3,100 | 910 | 4,800 |
| Weston | 10.9% | 68.1% | 21.0% | 670 | 4,200 | 1,290 | 6,170 |
| Weston Shops | no data | no data | no data | - | - | - | - |
| Westwood | 22.1% | 62.4% | 15.5% | 1,580 | 4,470 | 1,110 | 7,170 |
| Whyte Ridge | 13.2% | 72.0% | 14.8% | 960 | 5,250 | 1,080 | 7,300 |
| Wildwood | 19.4% | 66.1% | 14.5% | 190 | 650 | 140 | 980 |
| Wilkes South | 14.0% | 68.2% | 17.7% | 110 | 520 | 140 | 760 |
| William Whyte | 10.9% | 65.5% | 23.5% | 760 | 4,550 | 1,640 | 6,950 |
| Windsor Park | 16.0% | 65.6% | 18.4% | 1,650 | 6,770 | 1,900 | 10,330 |
| Wolseley | 12.9% | 71.3% | 15.8% | 980 | 5,370 | 1,190 | 7,540 |
| Woodhaven | 25.3% | 60.8% | 13.8% | 200 | 470 | 110 | 770 |
| Worthington | 18.6% | 63.0% | 18.4% | 1,050 | 3,570 | 1,040 | 5,660 |
What the map shows
This map shows how old Winnipeg's neighbourhoods are: the share of residents who are seniors, adults and children, based on the 2021 census.
Key findings:
Seniors are 65 and over, adults 15 to 64 and children 0 to 14, the census's own age groups.
Sources and licence
Back to the map